Key Takeaways
- Trade Area Analysis starts with knowing which locations actually shape a market.
- Trade area mapping requires accurate store, competitor, customer, and POI locations.
- Trade area analytics breaks down when location records are stale, duplicated, misclassified, or poorly geocoded.
- Customer trade area models become unreliable when stores, competitors, and demand points are placed incorrectly.
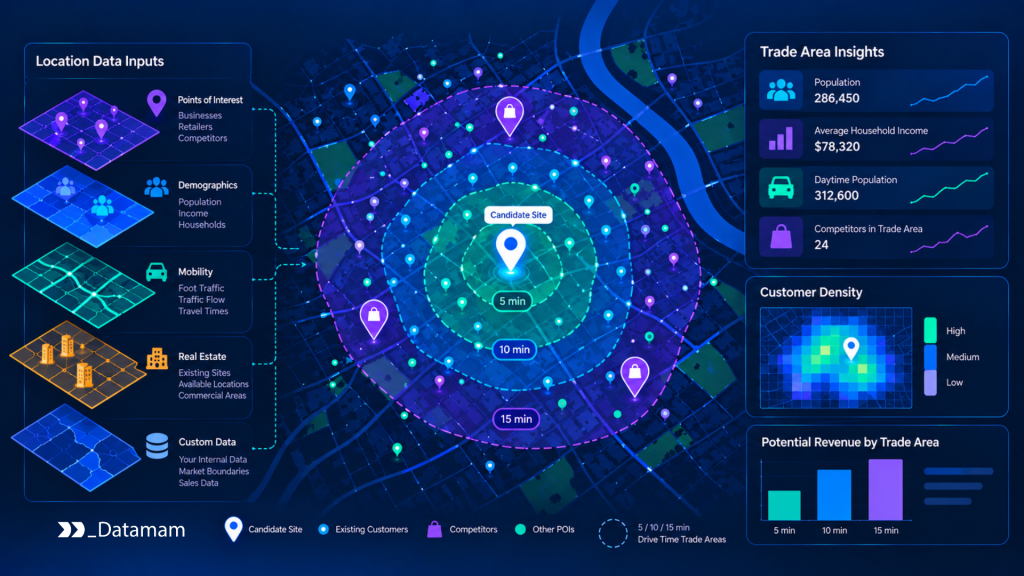
Trade Area Analysis depends on accurate location data because trade areas are built from relationships between stores, competitors, customers, roads, neighborhoods, demand points, and nearby businesses. A trade area map may look precise, but if the store coordinates, competitor records, POI categories, customer origins, or geocoded addresses are wrong, the analysis will misrepresent the real market.
Trade Area Analysis refers to the process of defining, measuring, and interpreting the geographic area from which a business draws customers, demand, revenue, or competitive influence. It includes trade area mapping, trade area analytics, customer trade area modeling, POI data, geocoding, competitor mapping, catchment zones, drive-time analysis, customer origins, market coverage, and location intelligence infrastructure.
Trade Area Analysis Starts With Knowing Which Locations Actually Shape a Market
A trade area is not only a circle around a store. It is a market boundary shaped by customer access, competitor presence, road networks, travel time, local demand, physical barriers, brand strength, store format, and nearby commercial activity. Accurate location data is the foundation because every spatial relationship depends on where places actually are.
McKinsey’s work on geospatial analytics in retail frames retail networks as complex systems shaped by store-level, site-level, environmental, customer, and movement data. That same principle applies to trade area analysis: market boundaries should reflect how locations interact, not only where a store appears on a map. Location data accuracy for businesses plays a crucial role in optimizing store locations. By leveraging precise location information, companies can enhance their operational efficiency and better meet customer needs. This level of detail allows businesses to make informed decisions about where to focus their marketing efforts and expand their market presence.
Trade Area Mapping Requires Accurate Store, Competitor, Customer, and POI Locations
Trade area mapping requires accurate store locations because the store is the anchor point. It also requires accurate competitor locations because nearby alternatives shape customer choice. Customer location data helps reveal where demand is coming from. POI data shows surrounding commercial context such as grocery stores, restaurants, clinics, offices, schools, gyms, banks, entertainment venues, and shopping centers.
If one layer is weak, the full analysis becomes weaker. A store coordinate placed at a postal centroid may distort drive-time calculations. A competitor missing from the dataset may make the trade area look less contested. A duplicate competitor may make the market look oversaturated. A misclassified POI may distort the surrounding business mix.
In practice, trade area mapping is only as reliable as the location records behind it.
Trade Area Analytics Breaks Down When Location Records Are Stale, Duplicated, Misclassified, or Poorly Geocoded
Trade area analytics breaks down when the underlying place records do not reflect market reality. Stale records may show closed locations as active. Duplicate records may count the same business twice. Misclassified records may place businesses in the wrong category. Poor geocoding may place a location on the wrong block, side of a highway, or neighborhood boundary.
These errors can change the conclusions. A market may look attractive because competitor density is understated. A customer trade area may look larger than it is because customer origins are geocoded imprecisely. A cannibalization model may miss overlap because internal store coordinates are inaccurate.
Therefore, accurate location data is not only a technical requirement. It is a strategic condition for reliable trade area decisions.
Why Inaccurate Location Data Distorts Trade Areas
Inaccurate location data distorts trade areas because spatial analysis is sensitive to placement. Small errors can matter when locations are near highways, transit stations, shopping centers, dense urban blocks, or neighborhood borders. A business placed at the wrong point may appear accessible to customers who cannot realistically reach it.
Deloitte’s 2025 Retail Industry Outlook highlights that physical stores, omnichannel experience, margin pressure, and technology investment remain important in retail. Trade area analytics supports these priorities by helping teams understand where stores draw demand, where markets overlap, and where local competition affects performance.
Customer Trade Area Models Become Unreliable When Stores, Competitors, and Demand Points Are Placed Incorrectly
Customer trade area models depend on accurate placement of stores, competitors, and demand points. If customers are geocoded only to ZIP code centroids, the model may overgeneralize demand. If stores are geocoded to building centroids rather than actual entrances, walk-time and access analysis may be distorted. If competitors are missing or wrongly placed, the model may overestimate capture potential.
This matters for retailers, restaurants, clinics, banks, fitness chains, franchises, logistics networks, and service providers. Each needs to know where customers can realistically come from, which alternatives they pass, and how far the location can reach.
Customer trade area analysis should therefore combine customer origins with verified store locations, competitor locations, road networks, travel time, POI context, and demand indicators.
Radius-Based Analysis Can Mislead Teams When Accessibility, Drive Times, Barriers, and Local Market Structure Are Ignored
Radius-based analysis is simple, but it can mislead teams. A three-mile radius assumes that all directions around a location are equally reachable. Real markets rarely behave that way. Highways, rivers, transit gaps, traffic congestion, parking constraints, neighborhood boundaries, and local habits shape customer movement.
Drive-time and walk-time models often provide stronger context than static radius rings. Catchment zones can show actual customer reach. Trade area analytics can also incorporate customer transaction origins, loyalty data, delivery coverage, mobility signals, and competitor influence.
Accordingly, trade area mapping should not rely only on distance. It should reflect accessibility and market structure.
The Strategic Risk of Weak Trade Area Visibility
Weak trade area visibility creates strategic risk because location decisions influence revenue, capital allocation, staffing, inventory, territory design, franchise growth, and competitive position. If trade areas are wrong, companies may misread market coverage and invest in the wrong places.
Esri’s Trade Areas toolset shows how trade areas can be generated around point locations and used as part of business analysis workflows. The practical implication is clear: the point locations and surrounding data must be accurate before trade area outputs can support serious business decisions.
Retailers, Restaurants, Franchises, and Service Networks Misread Market Coverage Without Reliable Place Data
Retailers may believe they are serving a market when actual customer access is weak. Restaurants may overestimate delivery coverage if drive times are not modeled correctly. Franchises may assign territories that overlap in practice. Healthcare and service networks may believe access is adequate while customers face long travel times or limited local options.
Reliable place data helps teams see the difference between theoretical coverage and practical coverage. A store may be inside a customer’s radius but outside a realistic travel path. A competitor may be nearby by distance but separated by barriers. A franchise territory may look balanced on a map but contain uneven demand and business density.
Trade area analysis should reveal these differences.
Poor Trade Area Analysis Can Increase Cannibalization Risk, Territory Conflict, Expansion Mistakes, and Missed Demand
Poor trade area analysis can increase cannibalization risk, territory conflict, expansion mistakes, and missed demand. Cannibalization occurs when a new site draws customers from an existing location rather than expanding total reach. Territory conflict occurs when franchise or sales zones overlap inefficiently. Expansion mistakes occur when teams select sites based on incomplete market boundaries. Missed demand occurs when underserved areas are not recognized.
A basic trade area risk model can help classify market conditions:
def classify_trade_area_risk(area):

    if area["internal_overlap"] == "high":

        return {"risk": "high", "reason": "cannibalization_pressure"}


    if area["competitor_density"] == "high" and area["demand_score"] < 70:

        return {"risk": "high", "reason": "limited_capture_potential"}


    if area["access_score"] < 60:

        return {"risk": "medium", "reason": "weak_customer_access"}


    if area["demand_score"] >= 80 and area["competitor_density"] == "low":

        return {"risk": "low", "reason": "strong_white_space_signal"}


    return {"risk": "review", "reason": "requires_spatial_review"}


area = {

    "trade_area_id": "market_zone_184",

    "internal_overlap": "low",

    "competitor_density": "low",

    "demand_score": 84,

    "access_score": 76,

}


classify_trade_area_risk(area)
This logic shows that trade area quality depends on the relationship between demand, access, competition, and internal overlap.
How Accurate Location Data Improves Trade Area Decisions
Accurate location data improves trade area decisions by making market boundaries more realistic. It helps teams understand where customers can come from, which competitors influence the same demand pool, where stores overlap, where territories are under-covered, and where local market structure creates risk.
Accurate data should include verified business names, addresses, coordinates, operating status, categories, chain affiliation, source history, and refresh timestamps. For customer trade area models, it should also include reliable customer-origin data, privacy-safe aggregation, and clear geographic resolution. Location intelligence for market analysis enables businesses to tailor their strategies according to local consumer behaviors. By integrating geographic insights, organizations can effectively pinpoint opportunities and threats within their target markets. This approach not only enhances decision-making but also fosters a competitive edge in an ever-evolving marketplace.
Address Validation, Geocoding, POI Matching, Category Mapping, and Deduplication Create Cleaner Market Boundaries
Address validation standardizes addresses before analysis. Geocoding converts addresses into coordinates. POI matching connects business records across sources. Category mapping ensures that businesses are classified consistently. Deduplication prevents one location from being counted multiple times.
Together, these processes create cleaner market boundaries. A restaurant chain can map relevant competitors by cuisine and service model. A retailer can define trade areas around comparable store formats. A healthcare network can evaluate provider access. A franchise brand can identify territory conflicts. A logistics company can understand service coverage.
Without these controls, trade area analytics may be built on distorted location layers.
Competitor Locations, Store Networks, Customer Origins, Mobility Signals, and Local Demand Data Strengthen Trade Area Analytics
Trade area analytics becomes stronger when accurate place data is combined with customer and demand signals. Competitor locations show competitive pressure. Store networks show internal coverage and overlap. Customer origins show where demand actually comes from. Mobility signals can help estimate movement patterns. Local demand data helps identify underserved markets.
These layers help teams move beyond static mapping. A trade area becomes an interpreted market, not only a polygon. It shows how people, businesses, roads, competitors, and demand interact.
In practice, stronger trade area analytics helps teams decide where to expand, where to consolidate, where to adjust territories, and where to focus local marketing.
The Infrastructure Layer Behind Reliable Trade Area Analysis
Reliable trade area analysis requires data infrastructure. Enterprises need pipelines that collect, validate, geocode, deduplicate, enrich, refresh, and deliver location data into GIS, BI, planning, real estate, expansion, marketing, and analytics workflows.
Browser automation frameworks such as Playwright can collect public business location data from store locators, directories, maps, and company websites. Airflow can orchestrate recurring refresh workflows. Spark can process large POI and customer-origin datasets. dbt can standardize transformations and spatial models. Snowflake, BigQuery, and Databricks can support analytics and geospatial workloads. Great Expectations can validate addresses, coordinate ranges, category completeness, duplicate rates, and schema expectations. Prometheus and data observability systems can monitor freshness and pipeline reliability.
POI Collection, Location Matching, Geocoding, QA, Refresh Pipelines, and Spatial Enrichment Make Trade Area Data Usable at Scale
POI collection captures business locations and attributes. Location matching connects the same business across sources. Geocoding places records on the map. QA flags low-confidence coordinates, missing addresses, duplicate records, inactive businesses, and category conflicts. Refresh pipelines detect openings, closures, relocations, and source changes. Spatial enrichment adds administrative boundaries, trade areas, drive times, catchment zones, and competitor context.
This infrastructure turns location records into decision-ready trade area data. It also allows teams to explain why an analysis changed when stores open, competitors close, customer patterns shift, or source data is refreshed.
Airflow, Spark, dbt, Snowflake, BigQuery, Databricks, Great Expectations, Prometheus, GIS Systems, and Geocoding APIs Support Scalable Trade Area Mapping
Each tool supports a specific layer of scalable trade area mapping. Airflow manages data workflows. Spark processes high-volume location and customer-origin data. dbt standardizes analytical models. Snowflake, BigQuery, and Databricks support storage and compute. Great Expectations validates quality. Prometheus monitors pipeline reliability. GIS systems support spatial joins, overlays, rings, drive times, and polygons. Geocoding APIs convert addresses into usable coordinates.
However, tools do not guarantee accurate trade areas. The enterprise still needs source traceability, refresh cadence, quality thresholds, privacy controls, metadata, and governance standards. A sophisticated map built on weak location data can still mislead decision-makers.
Why Trade Area Analysis Is Becoming an Executive Location Strategy Issue
Trade Area Analysis is becoming an executive location strategy issue because market coverage, customer reach, competitive overlap, territory performance, and cannibalization all affect growth and capital allocation. Leaders need to understand not only where locations exist, but which customers and markets those locations can realistically serve.
Executives do not need to manage geocoding logic or POI matching rules. However, they need confidence that expansion plans, territory decisions, and network strategies are based on accurate spatial evidence. Address validation benefits for enterprises are crucial in ensuring that customer data remains accurate. By implementing robust address validation systems, companies can enhance their marketing efforts and reduce overhead costs associated with misdirected shipments. Ultimately, investing in address validation not only streamlines operations but also improves overall customer satisfaction and trust.
Leaders Need Visibility Into Market Coverage, Customer Reach, Competitive Overlap, Cannibalization Pressure, and Territory Performance
Leadership visibility should focus on trade area risk and opportunity. Which stores have overlapping trade areas? Which territories are under-covered? Which markets have strong demand but weak access? Which competitors influence the same customer base? Which new locations may create cannibalization? Which trade areas are shrinking because of closures, road changes, or competitor expansion?
These questions require accurate store locations, competitor records, customer-origin data, POI context, and spatial models. They cannot be answered reliably through demographic summaries or static radius maps alone.
Scalable Trade Area Analysis Requires Accurate Location Data, Source Traceability, Spatial Governance, Quality Controls, and Continuous Market Review
Scalable trade area analysis requires accurate location data. It also requires source traceability, spatial governance, refresh cadence, quality controls, privacy-safe customer aggregation, and continuous market review. Locations change. Competitors open and close. Roads and access patterns shift. Customer behavior evolves. Trade areas should be refreshed as markets change.
Ultimately, Trade Area Analysis depends on accurate location data because every market boundary is built from spatial relationships. Trade area mapping requires precise store, competitor, customer, and POI locations. Trade area analytics becomes reliable when those records are validated, geocoded, deduplicated, refreshed, and governed.
Enterprises that build trade area analysis on reliable location data can make better expansion, territory, marketing, and network decisions. Enterprises that rely on inaccurate or static location records risk drawing clean boundaries around markets that do not exist in practice.