
Key Takeaways
- Coverage Mapping Systems help enterprises understand which external sources cover which markets, entities, regions, categories, and business signals.
- Source coverage mapping prevents sourcing programs from relying on incomplete or uneven source footprints.
- Coverage gap analysis identifies missing sources, weak regions, unstable categories, and underrepresented market segments before downstream systems depend on them.
- A data coverage model connects source availability to business requirements, analytics use cases, AI workflows, and governance expectations.
- Source footprint analysis should be reviewed continuously because market coverage, source availability, vendor access, and business priorities change over time.
External data sourcing programs often fail because teams assume that source availability equals source coverage. A provider may offer many sources, a public dataset may appear comprehensive, or an internal sourcing list may look complete. However, coverage gaps often remain hidden until downstream teams discover missing markets, weak categories, underrepresented regions, or inconsistent entity visibility.
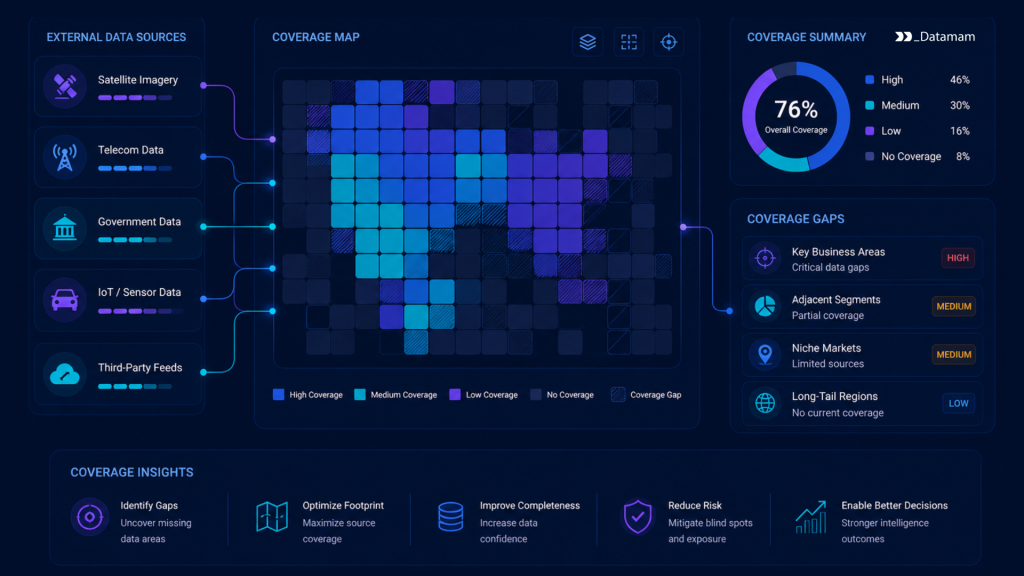
Coverage Mapping Systems provide the structure for evaluating what external sources actually cover. They define which sources support which geographies, categories, entities, time periods, update frequencies, and business use cases. In enterprise data sourcing, coverage mapping is not a documentation exercise. It is a control layer that determines whether sourcing programs can support reliable market intelligence, AI workflows, compliance monitoring, pricing analysis, procurement visibility, and executive reporting.
The objective is to make source coverage visible before incomplete data becomes an operational dependency.
Why Coverage Mapping Systems Matter in Data Sourcing
Coverage Mapping Systems matter because external data coverage is rarely uniform. A source may be strong in one geography and weak in another. A vendor may cover major marketplaces but miss niche channels. A public source may provide historical records but lack current updates. A commercial provider may cover core entities but omit important subcategories.
According to Gartner’s 2025 data and analytics trends, data and analytics are moving from specialized teams into broader organizational use, raising the stakes for governance, reliability, and operational control. In external sourcing programs, coverage mapping is one of the first controls needed before data becomes broadly consumed. Data sourcing strategies for businesses play a crucial role in ensuring that the right information is accessible at the right times. By employing effective sourcing techniques, companies can enhance their data quality and usability, ultimately leading to better decision-making. It’s essential for organizations to regularly assess and refine their data sourcing strategies to adapt to changing market conditions and consumer needs.
Why Source Coverage Must Be Explicitly Modeled
Source coverage should not be inferred from source count. A sourcing program may have hundreds of sources but still miss important markets or decision-critical entities. By contrast, a smaller source set may provide stronger coverage if the sources are authoritative, current, and aligned with the use case.
Explicit source coverage mapping documents what each source contributes. This may include geography, language, category, product class, competitor, supplier, regulation type, publication cadence, historical depth, source authority, and access method. These attributes allow teams to evaluate coverage at the level that matters for decision use.
For example, a procurement sourcing program may need supplier coverage by region and category. A market intelligence workflow may need competitor coverage by channel and product line. An AI workflow may need diverse source coverage across examples, labels, and edge cases. Without explicit mapping, teams cannot evaluate whether the data foundation is fit for purpose.
How Hidden Coverage Gaps Create Downstream Risk
Hidden coverage gaps create false confidence. A dashboard may show market activity, but only for the sources that were captured. A model may learn from external data, but only from well-covered segments. A compliance monitor may appear operational while missing jurisdictions or document types. The absence of data can be mistaken for the absence of activity.
This is dangerous because downstream users rarely see the sourcing boundaries. They see outputs, metrics, and model features. If coverage gaps are not made visible, business teams may interpret incomplete data as complete intelligence.
IBM’s 2025 CDO Study frames decision-ready data as central to AI and enterprise data strategy. Decision-ready data requires coverage transparency. If the enterprise cannot explain what the source set covers and what it misses, downstream decisions inherit uncertainty.
Source Coverage Mapping Across External Data Programs
Source coverage mapping defines the relationship between sources and business requirements. It answers practical questions: Which sources cover which markets? Which entities are visible? Which categories are missing? Also, which sources overlap? Which regions are underrepresented? Which source types are authoritative?
The mapping process should be structured enough to support sourcing decisions, but flexible enough to adapt as new sources, vendors, and use cases emerge. Construction data strategies for bidding can significantly enhance the accuracy of cost estimates and project timelines. These strategies also provide insights into competitive positioning, allowing businesses to align their offerings more effectively. By systematically analyzing construction data, companies can make informed decisions that drive better outcomes in their bidding processes.
Mapping Sources by Market, Region, Category, and Entity
Coverage should be mapped across the dimensions that matter to the business. For retail and marketplace intelligence, that may include product category, seller, geography, marketplace, brand, price tier, and availability signal. For procurement, it may include supplier, category, region, contract type, and risk indicator. Also, for regulatory monitoring, it may include jurisdiction, agency, document type, topic, and publication cadence.
Entity-level mapping is especially important. A source may cover a category broadly but miss specific suppliers, competitors, products, facilities, or document classes. A coverage map should identify both breadth and depth.
In practice, teams often build a coverage matrix that connects sources to required dimensions. This matrix becomes a sourcing control artifact. It helps teams see whether a program is balanced, redundant, under-covered, or overdependent on a narrow set of sources.
Distinguishing Claimed Coverage from Verified Coverage
Claimed coverage and verified coverage are not the same. A vendor may claim coverage across a country, industry, or category, but actual data availability may vary by submarket, update frequency, or source depth. A public source may appear comprehensive but contain gaps in historical records. A web source may list many entities, but only update some of them consistently.
Verified coverage requires evidence. Teams should test source records, measure completeness, compare against known entities, inspect update history, and evaluate missingness across required dimensions. Vendor samples should be tested against business-defined coverage requirements, not only reviewed for format.
This distinction is critical in supplier review, AI data sourcing, market monitoring, and compliance workflows. Enterprises should not treat coverage claims as operational coverage until they are tested and documented.
Coverage Gap Analysis for Source Reliability
Coverage gap analysis identifies where the sourcing program is incomplete. It compares required coverage against actual coverage and highlights missing sources, weak segments, inconsistent regions, unstable categories, and insufficient historical depth.
This analysis is not only useful during onboarding. It should continue as source behavior changes, vendors update offerings, markets evolve, and internal use cases expand.
Identifying Missing Sources, Weak Segments, and Underrepresented Markets
Coverage gaps can appear in several forms. A region may be missing entirely. A category may have only one weak source. A competitor may be visible in one channel but absent in another. A supplier market may be covered in developed regions but not in emerging markets. A regulatory workflow may cover national agencies but miss local authorities.
Coverage gap analysis should compare source availability against business priorities. Not every missing source is important. A gap matters when it affects a decision, report, model, or governance obligation. The analysis should therefore include criticality scoring.
A practical coverage gap analysis may classify gaps by severity: critical gaps that block decision use, moderate gaps that reduce confidence, and low-priority gaps that are acceptable for the current use case. This helps teams prioritize sourcing investments.
Measuring Coverage Quality, Not Only Coverage Quantity
Coverage quantity measures how many sources, markets, or entities are included. Coverage quality measures whether the coverage is reliable, current, authoritative, and usable. A sourcing program can have high quantity and low quality.
Coverage quality should evaluate source authority, freshness, completeness, stability, documentation, duplication, legal usability, and downstream compatibility. For example, ten low-authority sources may not be better than two authoritative sources. A source with broad coverage but irregular updates may be less useful than a narrower source with reliable refresh behavior.
The OECD.AI 2025 Data Governance Working Group Report highlights the technical, legal, and institutional dimensions of data governance. Coverage quality reflects those same dimensions because enterprises must evaluate not only whether data exists, but whether it is usable, governed, and reliable enough for the intended purpose.
Designing a Data Coverage Model
A data coverage model formalizes how source coverage is represented, scored, and governed. It turns coverage from a subjective judgment into a structured operating asset. The model should connect sourcing coverage to business use cases, data products, governance controls, and downstream systems.
A strong data coverage model allows teams to answer coverage questions consistently. It also supports procurement decisions, vendor evaluation, risk review, AI dataset design, and market intelligence planning. Source classification techniques for data analysis play a crucial role in enhancing the accuracy of data coverage models. By leveraging these techniques, organizations can ensure that their data products are not only relevant but also trustworthy. Moreover, integrating source classification methods into the data governance framework can streamline vendor evaluations and improve overall risk management.
Defining Required Coverage by Business Use Case
Coverage requirements should begin with business use cases. A pricing intelligence use case may require daily coverage of competitor prices across major marketplaces. A procurement risk use case may require supplier coverage across regions, ownership structures, and risk indicators. An AI training use case may require diverse examples across source types, languages, categories, and edge cases.
Each use case should define the minimum required coverage. This may include required sources, required entities, acceptable gaps, refresh expectations, historical depth, geographic scope, and source authority thresholds.
Without use-case definitions, coverage analysis becomes abstract. Teams may collect more sources without knowing whether those sources improve decision readiness. A data coverage model keeps sourcing aligned to operational needs.
Scoring Coverage Depth, Breadth, Freshness, and Authority
Coverage scoring should include multiple dimensions. Breadth measures how many markets, categories, entities, or source types are included. Depth measures how complete the coverage is within each segment. Freshness measures whether coverage is current enough for the use case. Authority measures whether the source is credible for the signal it provides.
A source footprint may be broad but shallow. Another may be narrow but authoritative. A third may be fresh but incomplete. A useful coverage model makes these tradeoffs visible.
Scoring can support source prioritization and vendor assessment. It helps teams decide whether to add sources, replace vendors, adjust refresh cycles, or accept known gaps with documented limitations.
Source Footprint Analysis in Enterprise Sourcing
Source footprint analysis examines the total presence and distribution of sources across the sourcing program. It looks at how the source portfolio is spread across geographies, categories, source types, vendors, access methods, and authority levels.
This analysis helps enterprises avoid overdependence, blind spots, duplication, and false coverage confidence.
Understanding Source Distribution Across the Portfolio
A source footprint analysis should show where the sourcing program is strong and where it is exposed. It may reveal that most sources come from one vendor, one region, one access method, or one platform type. It may show that some categories are covered by multiple sources, while others depend on a single fragile feed.
This matters because concentration creates risk. If a single vendor controls most coverage in a critical region, vendor failure becomes source failure. If a sourcing program relies heavily on one access model, access degradation can affect many downstream workflows.
KPMG’s 2025 third-party security considerations describe third-party security as a central enterprise risk as organizations rely on more vendors and services. Source footprint analysis helps apply that same oversight logic to external data sourcing by making vendor and source concentration visible.
Managing Redundancy, Overlap, and Single-Source Dependency
Not all overlap is wasteful. Some redundancy improves confidence, supports reconciliation, and protects continuity. However, uncontrolled overlap can increase cost and complexity without improving coverage. Single-source dependency, by contrast, can create major reliability risk when the source is critical.
Source footprint analysis helps teams distinguish useful redundancy from unnecessary duplication. It also identifies where backup sources are needed. A critical source with no alternative may require closer monitoring, stronger contractual controls, or a replacement plan.
In enterprise sourcing, the goal is not to maximize source count. The goal is to design a source footprint that supports the required decisions with acceptable risk.
Technology and Integration Considerations
Coverage Mapping Systems require technology support because coverage metadata changes over time. New sources are added. Vendors modify feeds. Regions expand. Source quality changes. Downstream use cases evolve. A static spreadsheet can be useful initially, but enterprise programs need coverage metadata connected to operational systems.
The technology layer should support coverage metadata, source catalogs, scoring models, dashboards, lineage, and governance workflows.
Building Coverage Metadata into Source Catalogs and Data Platforms
Coverage metadata should be stored in a structured source catalog. Each source should include coverage dimensions such as geography, category, entity type, source authority, refresh cadence, access method, vendor, legal status, documentation level, and downstream use cases.
This metadata should connect to data platforms such as Snowflake, BigQuery, Databricks, and internal catalogs. It should also connect to transformation and orchestration systems such as dbt and Airflow, where possible. When a source feeds a dataset, users should be able to understand what the source covers and what it does not cover.
Coverage metadata improves transparency. Analysts and business users can evaluate whether a dataset is appropriate before relying on it.
Connecting Coverage Maps to Monitoring, Lineage, and Governance
Coverage maps should connect to monitoring systems, lineage tools, and governance controls. Monitoring can show whether expected coverage is being maintained. Lineage can show which downstream dashboards, models, or reports depend on a source. Governance controls can preserve ownership, review status, usage rights, and source restrictions.
For example, if a source stops covering a region, lineage should identify which outputs are affected. If a vendor reduces coverage, governance records should trigger review. If coverage gaps appear in a high-impact use case, the sourcing team should prioritize remediation.
This integration turns coverage mapping from planning documentation into operational infrastructure.
Governance and Review Cycles for Coverage Mapping
Coverage mapping requires governance because coverage changes. A source that was complete last quarter may be incomplete today. A vendor may lose access. A new business unit may require new market coverage. A compliance requirement may introduce new source needs.
Governance defines who owns coverage maps, how often they are reviewed, what evidence is required, and how gaps are escalated.
Creating Review Ownership, Scoring Rules, and Audit Trails
Coverage mapping should have defined ownership. Business owners define required coverage. Data teams validate technical availability. Procurement or sourcing teams evaluate vendor coverage. Governance teams review usage constraints and auditability.
Scoring rules should be documented so coverage assessments are consistent. If coverage depth, freshness, or authority are scored, teams should know how the score is calculated. Audit trails should record when coverage was reviewed, who approved it, what evidence was used, and what gaps were accepted.
This creates accountability. Coverage assumptions become reviewable rather than informal.
Updating Coverage Maps as Sources and Business Priorities Change
Coverage maps should be updated when sources change, vendors change, markets expand, business priorities shift, or downstream use cases are added. Updates should not depend on occasional manual cleanup. They should be part of sourcing operations.
A structured review cycle may occur quarterly for strategic sources and more frequently for high-volatility or high-risk sources. Critical gaps should trigger remediation plans. Accepted gaps should be documented with a rationale and review dates.
Coverage Mapping Systems help enterprises maintain alignment between sourcing reality and business expectations as the external data environment changes.
Conclusion: Turning Source Coverage into a Controlled Sourcing Asset
Coverage Mapping Systems help enterprises understand whether external data sourcing programs actually cover the markets, entities, categories, regions, and signals that business teams depend on. Without coverage mapping, organizations may rely on incomplete source sets while assuming their external data foundation is comprehensive.
Strong source coverage mapping distinguishes claimed coverage from verified coverage. Coverage gap analysis identifies missing or weak segments before downstream systems inherit the risk. A data coverage model turns coverage into measurable criteria across breadth, depth, freshness, and authority. Source footprint analysis reveals concentration, redundancy, overlap, and single-source dependency.
The capability matters because coverage gaps become decision gaps. Market intelligence, AI workflows, compliance monitoring, procurement analysis, and executive reporting all depend on knowing what the source portfolio covers and where it remains incomplete.
A structured review can help evaluate whether current sourcing workflows have reliable coverage mapping systems, source coverage mapping, coverage gap analysis, data coverage models, and source footprint analysis controls. You can run an external data infrastructure audit with our team to review your current setup and understand what is required to build a reliable, enterprise-scale external data infrastructure.