Key Takeaways
- Category Management should combine internal performance with external competitor evidence without treating correlation as causation.
- Competitor prices, promotions, assortment changes, and availability can generate category hypotheses, but they do not by themselves establish why sales or margin changed.
- Assortment analysis should track persistent product entities and lifecycle states rather than raw listing counts.
- A disappeared listing is not automatically a confirmed assortment removal.
- Promotion analysis should preserve mechanic, depth, duration, eligibility, affected products, and recurrence instead of relying on a simple promotion flag.
- Product matching and category mapping are separate processes and should be measured separately.
- Key value items, category roles, margin priorities, and strategic relevance usually come from internal retailer reference data.
- Out-of-stock and unresolved observations can remain valid evidence even when they require different treatment in a specific category decision.
- Category intelligence quality should be measured through comparability, coverage, lifecycle accuracy, promotion classification, freshness, and traceability rather than the volume of competitor records collected.
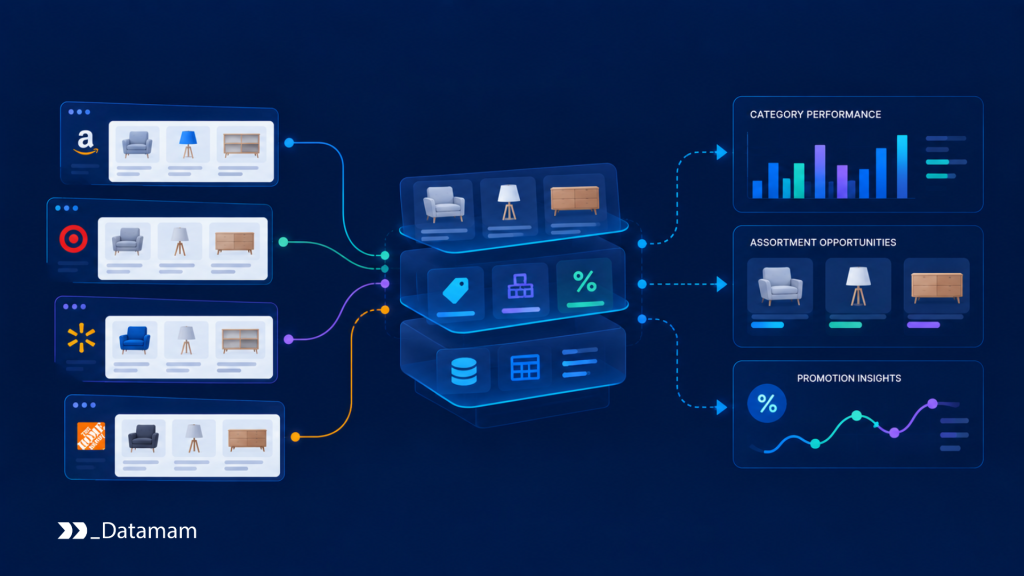
A category can lose sales while competitors hold prices steady.
Another can grow while rivals increase promotions.
A competitor may add dozens of listings without actually expanding its unique product range.
A product may disappear from a retailer’s website because it was removed, consolidated into another variant, temporarily unavailable, or simply missed by the latest collection run.
Making Better Category Decisions
These observations matter, but none of them explains category performance by itself.
Category Management becomes more useful when teams combine internal performance with structured external evidence while keeping a clear distinction between what was observed, what it might mean, and what has actually been established.
Internal sales, inventory, margin, and promotion data describe the retailer’s own performance. Competitor prices, assortment changes, promotions, and availability provide additional context about the market customers encounter elsewhere.
The useful operating model is:
internal performance + normalized external observations → category hypotheses → supporting or contradicting evidence → category review and decision
Internal Performance and External Market Evidence Answer Different Questions
Category teams already have substantial internal data.
Depending on the retailer, this can include:
- sales;
- units;
- margin;
- inventory;
- sell-through;
- conversion;
- returns;
- internal promotions;
- supplier performance;
- product content;
- search and merchandising performance.
These measures answer questions about the retailer’s own business.
External competitor observations answer different questions:
- What prices are competitors displaying?
- Which comparable products are available?
- What promotion mechanics are visible?
- Which products are newly observed?
- Which products are no longer observed?
- How broad is competitor coverage across brands, packs, sizes, or price tiers?
- Which offers are currently unavailable?
- Are several relevant competitors moving in the same direction?
The distinction matters because the same internal outcome can have several possible explanations.
If sales fall, possible explanations might include:
- weaker internal availability;
- a pricing gap;
- stronger competitor promotion activity;
- an assortment gap;
- product-content issues;
- changing demand;
- seasonality;
- internal execution problems.
Competitor observations can strengthen or weaken some of those hypotheses.
They do not automatically prove which one caused the result.
The Deloitte 2026 Global Retail Industry Outlook reinforces the importance of data-driven insight alongside financial discipline, operational execution, and customer value in the current retail environment. Its global survey of 330 retail executives also shows retailers placing substantial attention on value, product mix, pricing, and operational discipline. Retail competitor analysis techniques can provide invaluable insights into market trends and consumer behavior. By employing these techniques, businesses can identify their strengths and weaknesses relative to their peers. Additionally, staying updated with competitor strategies allows retailers to adapt and innovate effectively in a rapidly changing landscape.
Competitor Evidence Should Generate Hypotheses, Not Causal Conclusions
Consider a category where unit sales fall by 8%.
During the same period, several competitors increase promotion activity.
That supports a hypothesis:
competitor promotion pressure may have contributed to the sales decline.
It does not establish:
competitor promotions caused sales to fall.
Other evidence may point elsewhere.
Perhaps internal stock availability deteriorated at the same time.
Perhaps the category is seasonal.
Also, perhaps a key product lost search visibility.
Perhaps the retailer changed its own promotion calendar.
A stronger category-analysis workflow therefore records competing explanations rather than forcing one diagnosis.
For example:
| Internal Observation | External Observation | Useful Hypothesis | Additional Evidence Needed |
| Sales down | Promotion activity increased across relevant competitors | Competitive promotion may be contributing | Internal availability, own promotion history, comparable-product sales |
| Sales down | Competitor pricing stable | Price pressure is less strongly supported | Stock, content, traffic, conversion, demand indicators |
| Margin down | Own discount depth increased | Internal promotion may be contributing | Promotion-level sales and margin analysis |
| Sales down | Competitor assortment broadened in a relevant subcategory | Assortment gap may warrant investigation | Internal range coverage, product demand, substitution evidence |
| Conversion down | Competitors remain available while internal stock weakens | Availability may be contributing | Internal inventory and fulfillment data |
The important output is a testable explanation, not an automatic conclusion.
Competitor Price Position Needs Product and Offer Context
Category teams should not compare prices before establishing what is actually comparable.
Depending on the category, product resolution may require:
- brand;
- model;
- GTIN or UPC;
- manufacturer identifier;
- size;
- pack count;
- color;
- configuration;
- unit of measure;
- product condition;
- bundle composition;
- category-specific attributes.
The resulting relationship should be explicit:
- exact product;
- same underlying product, different pack or variant;
- close comparable;
- broader substitute;
- non-comparable;
- unresolved.
A $5 price gap on an exact comparable does not mean the same thing as a $5 gap against a broader substitute.
The same applies to offer context.
A category record may need to distinguish:
- standard price;
- promotional price;
- loyalty price;
- multi-buy price;
- coupon;
- marketplace offer;
- unit-normalized price;
- fulfillment charge.
Category analysis should preserve those differences rather than collapse them into one generic competitor-price field. Competitor pricing strategies in retail vary widely, reflecting different market dynamics and consumer behaviors. Understanding these variations is crucial for businesses aiming to position themselves effectively. By analyzing the specific approaches of competitors, companies can identify opportunities for differentiation and innovation.
Internal Product Roles Should Stay Separate From External Observations
A competitor feed can tell the retailer what was observed externally.
It cannot decide whether the retailer’s own product is:
- a key value item;
- traffic-driving item;
- premium product;
- strategic private-label SKU;
- clearance priority;
- margin-sensitive line;
- seasonal focus item.
Those are internal category and pricing classifications.
The more useful model is:
validated competitor observation + internal product/category role → category relevance
That avoids allowing external data to invent business strategy.
For example, the same competitor price gap may receive different attention for:
- a highly monitored value item;
- a premium differentiated product;
- a long-tail SKU.
The competitor evidence is the same.
Its internal relevance differs.
Assortment Change Should Be Tracked as a Lifecycle
Assortment monitoring becomes unreliable when teams simply compare the number of URLs collected this week with the number collected last week.
A product listing can appear or disappear for many reasons.
A useful lifecycle might distinguish:
- first observed
- active
- temporarily unavailable
- no longer observed
- reappeared
- confirmed removed or retired where evidence supports that conclusion
This matters because:
no longer observed
does not automatically mean:
competitor deliberately removed the product from its assortment.
A page may disappear because:
- the URL changed;
- variants were consolidated;
- the item went out of stock;
- a marketplace seller exited;
- the source changed;
- the collection process failed.
Category teams should preserve the observation state and only use stronger labels when the evidence supports them.
Measure Assortment Breadth With Product Entities, Not Page Counts
Raw listing volume can exaggerate assortment breadth.
One competitor may publish each color or size as a separate page.
Another may combine every variant onto one product page.
Marketplace listings may duplicate the same underlying product across sellers.
A normalized category view should therefore measure entities such as:
- unique active products;
- brands represented;
- product families;
- pack or size coverage;
- attribute coverage;
- price-tier coverage;
- private-label presence where identifiable;
- newly observed products;
- no-longer-observed products;
- availability-adjusted active assortment.
For example, a competitor moving from 500 to 550 URLs does not necessarily mean its assortment expanded by 10%.
The increase might consist entirely of newly separated variants or duplicate seller offers.
Entity resolution should happen before assortment-growth claims are made.
Assortment Expansion Is an Observation, Not Proof of Strategy
Suppose a competitor adds 25 normalized product entities to a subcategory.
The defensible conclusion is:
the competitor’s observed active assortment increased in this subcategory.
It does not automatically establish:
- stronger demand expectations;
- strategic investment;
- supplier confidence;
- market-share ambitions.
Those may be possible interpretations.
They require additional evidence.
The same principle applies when assortment contracts.
A sustained reduction may deserve investigation, but public listings alone usually cannot tell the category team whether the cause was:
- weak sell-through;
- supplier constraints;
- intentional rationalization;
- seasonal reset;
- product replacement.
Category intelligence should make the external change visible without pretending to know the competitor’s internal reason.
Promotion Mechanics Matter More Than a Promotion Flag
A field such as:
promotion = true
does not provide enough information for category analysis.
Promotions can take very different forms:
- visible markdown;
- coupon;
- loyalty price;
- multi-buy;
- bundle;
- rebate;
- clearance;
- minimum-spend offer;
- member pricing.
A stronger promotion record can preserve:
- base price;
- promotional price;
- discount depth;
- promotion mechanic;
- eligibility requirement;
- start and end where observable;
- observed duration;
- affected product set;
- recurrence;
- location or channel.
That makes it possible to distinguish:
more products are being promoted
from:
promotions have become deeper
or:
promotion frequency has increased.
Those are different category signals.
Recent NIQ guidance on retail execution similarly emphasizes evaluating assortment, pricing, and promotions together rather than relying only on surface-level metrics. The article is written for emerging brands rather than retail category teams, so it should be treated as supporting context rather than a universal category-management framework.
Promotion Activity Does Not Establish Competitor Intent
Repeated promotions can increase observed competitive pressure.
They do not reveal why the competitor chose them.
For example, a recurring discount could relate to:
- a planned promotion calendar;
- loyalty acquisition;
- seasonal activity;
- inventory position;
- supplier funding;
- clearance;
- another commercial objective.
External monitoring can establish:
- what was promoted;
- by how much;
- for how long;
- how often;
- across which products.
It generally cannot establish the internal intent behind the promotion.
That distinction keeps category analysis evidence-based.
Availability Is a Separate Market Signal
A competitor price has different implications when the product is unavailable.
But an out-of-stock observation is not invalid data.
It can still contribute to:
- historical price analysis;
- availability comparisons;
- assortment-state tracking;
- promotion history;
- category context.
The record should preserve states such as:
- in stock;
- limited stock;
- out of stock;
- delivery only;
- pickup only;
- backordered;
- unknown.
Then the category workflow determines whether that state matters for the current question.
For example:
observation_valid = true
stock_status = out_of_stock
current_price_comparison_relevance = low
The price record remains part of history.
Product Matching and Category Mapping Are Different Processes
These two concepts are often combined, but they answer different questions.
Product Matching
What product is this, and how does it relate to an internal or competitor product?
Category Mapping
Where should this product sit within the retailer’s category taxonomy?
A product might be matched with high confidence while category mapping remains ambiguous.
Or the category may be obvious while exact product identity is unresolved.
Keeping them separate improves:
- quality measurement;
- exception handling;
- taxonomy changes;
- troubleshooting;
- downstream category analysis.
A category-intelligence record should preserve both relationship and mapping status.
External Category Evidence Needs Internal Performance to Become Useful
External monitoring becomes most useful when it is joined to internal category performance at an appropriate level.
Possible join dimensions include:
- internal product;
- comparable-product group;
- subcategory;
- brand;
- price tier;
- pack/size segment;
- store or region;
- time period.
The joined data can then support questions such as:
- Did sales weaken while relevant competitors increased promotion coverage?
- Did internal stock availability deteriorate while competitor availability remained stable?
- Is the retailer missing a product format that has become more common across several competitors?
- Has relative price position changed on internally defined key value items?
- Did competitor assortment expansion occur before, during, or after the retailer’s own category slowdown?
These are useful analytical questions.
They are still not causal proof.
The role of the combined data is to narrow the hypotheses worth investigating.
A Better Category Hypothesis Model
Instead of coding category causes directly, the system can generate hypotheses with supporting evidence.
def generate_category_hypotheses(category):

    hypotheses = []


    if (

        category["sales_trend"] == "down"

        and category["competitor_promotion_change"] == "increased"

    ):

        hypotheses.append({

            "hypothesis": "competitive_promotion_pressure",

            "evidence": [

                "internal_sales_down",

                "competitor_promotion_activity_increased",

            ],

            "status": "requires_validation",

        })


    if (

        category["sales_trend"] == "down"

        and category["internal_availability"] == "weaker"

    ):

        hypotheses.append({

            "hypothesis": "internal_availability_constraint",

            "evidence": [

                "internal_sales_down",

                "internal_availability_weaker",

            ],

            "status": "requires_validation",

        })


    if category["competitor_assortment_change"] == "expanded":

        hypotheses.append({

            "hypothesis": "possible_assortment_gap",

            "evidence": [

                "normalized_competitor_assortment_expanded",

            ],

            "status": "requires_internal_range_review",

        })


    return hypotheses
The code deliberately does not return:
cause = competitor_promotions
or:
action = expand_assortment
It records what evidence exists and what explanation deserves further review.
The category team still determines whether the hypothesis is supported.
Category Decisions Need Shared Evidence Across Functions
Pricing, merchandising, ecommerce, inventory, supplier, and analytics teams may look at the same category from different angles.
Without structured evidence: Competitor pricing analysis techniques can provide valuable insights into market trends and consumer behavior. By regularly assessing competitors, teams can identify opportunities for pricing adjustments or promotional strategies. Ultimately, this helps in optimizing overall revenue and maintaining a competitive edge.
- pricing sees a price gap;
- merchandising sees a range gap;
- inventory sees stock constraints;
- ecommerce sees conversion changes.
Shared category intelligence creates a common evidence layer.
That does not mean every function reaches the same conclusion.
It means they can work from the same:
- product relationships;
- assortment states;
- price history;
- promotion mechanics;
- availability records;
- competitor entities;
- timestamps.
The Deloitte 2026 research on the future of merchandising, based on a survey of 570 merchandising executives and professionals across U.S. mass, grocery, and apparel retail, similarly points toward more data-driven and granular merchandising decisions across product, pricing, and assortment. The U.S. scope should remain explicit when applying those findings internationally.
A Category Intelligence Workflow
A functional data model can be organized as:
collection → product/entity resolution → category mapping → price and promotion normalization → assortment-state tracking → availability mapping → historical comparison → internal-category join → hypothesis generation → category review
External Observation
A source-level observation may preserve:
- source URL;
- retailer or marketplace;
- seller where applicable;
- raw product identity;
- raw category;
- observed price;
- promotion text;
- stock message;
- observed timestamp.
Normalized External Record
The normalized layer may add:
- resolved product entity;
- product relationship;
- internal category mapping;
- normalized pack or variant;
- normalized price type;
- promotion mechanic;
- availability state;
- assortment lifecycle state;
- source freshness;
- quality status.
Internal Enrichment
Internal retailer data may add:
- internal category role;
- key value item status;
- margin profile;
- inventory position;
- own promotion calendar;
- sales trend;
- strategic product classification.
Category Hypothesis
The analytical layer can then preserve:
- hypothesis;
- supporting external evidence;
- supporting internal evidence;
- contradicting evidence;
- unresolved questions;
- review status.
That keeps facts, classifications, internal strategy, and interpretation separate.
How to Measure Category Intelligence Quality
The number of competitor products collected is not a sufficient quality measure.
More useful metrics include:
| Area | Example Measure |
| Competitor coverage | Share of required retailers, marketplaces, or markets observed |
| Product resolution | Share linked to usable product entities |
| Match quality | Precision of reviewed exact/comparable relationships |
| Category mapping | Share mapped to the correct internal taxonomy |
| Assortment lifecycle | Share with reliable active/unavailable/no-longer-observed states |
| Assortment normalization | Duplicate and variant-resolution rate |
| Price context | Share with usable price type and comparison basis |
| Promotion classification | Share with mechanic, depth, or eligibility context |
| Availability | Share with usable availability state |
| Historical continuity | Share with sufficient history for change analysis |
| Freshness | Share meeting the category workflow’s observation requirements |
| Exception rate | Share requiring manual review |
| Traceability | Share linked to source observation and transformation/rule version |
Assortment growth, promotion pressure, and price-position metrics should only be calculated after the underlying entities and states are reliable.
How to Evaluate Category Intelligence Readiness
A retail category management workflow should be able to answer:
- Are internal performance metrics separated from external market observations?
- Are competitor observations treated as evidence rather than automatic explanations of internal performance?
- Can the system preserve several competing hypotheses for the same category change?
- Are exact products, comparable products, and substitutes distinguished?
- Are product matching and category mapping evaluated separately?
- Is competitor assortment measured using normalized product entities rather than raw listing counts?
- Can the system distinguish first observed, active, temporarily unavailable, no longer observed, and reappeared products?
- Does a disappeared listing remain “no longer observed” unless stronger evidence supports confirmed removal?
- Are base price, promotional price, loyalty price, coupons, and multi-buy mechanics stored separately?
- Are promotion depth, duration, frequency, and eligibility represented explicitly?
- Can out-of-stock observations remain valid category-history records?
- Are key value items, category roles, margin priorities, and strategic relevance supplied by internal reference data?
- Is customer substitution treated as a hypothesis unless shopper or transactional evidence exists?
- Can assortment or promotion changes be described without assigning unsupported competitor intent?
- Does every category hypothesis preserve the evidence that generated it?
- Can category teams trace a conclusion back to internal metrics, external observations, and review decisions?
These questions reveal whether competitor monitoring is merely adding more data or actually improving category analysis.
Conclusion
Category Management becomes stronger when external competitor data adds context without pretending to explain more than it can establish.
Internal performance tells the retailer what happened in its own category.
Competitor monitoring shows observed changes in prices, assortment, promotions, and availability.
Product matching and category mapping determine whether those observations are comparable.
Historical tracking determines whether a change is new, persistent, recurring, or uncertain.
Internal category strategy determines which external signals matter most.
The analytical layer then uses those inputs to generate and test hypotheses before category teams decide what to do.
The useful model is therefore not:
sales fall + competitor changes → competitor caused the problem
It is:
observe → normalize → compare → generate hypotheses → validate → decide
That gives category teams a clearer basis for separating internal execution issues from external competitive conditions while avoiding conclusions that the available evidence cannot support.