
Key Takeaways
- The meaningful denominator is the business work due, not HTTP requests returned. A successful page request can contain a challenge, the wrong market, or an incomplete search.
- Across three documented Datamam operating cohorts, on-time completion ranged from 99.17% to 99.31%. Final completion after a separate 48-hour recovery period ranged from 99.72% to 99.83%. These are workload-specific observations, not a market-wide benchmark or a contractual guarantee.
- An empty answer can be a correct answer. In airline monitoring, 4,769,809 completed searches found no qualifying itinerary, while 32,439 searches remained unresolved. Combining those states would distort commercial availability.
- Timeliness, accuracy, and source coverage require separate measures. The airline sample agreed with accepted source evidence in 12,474 of 12,500 reviewed fare observations, but that result is not a population-wide guarantee.
- A usable benchmark ends at the consumer. The accepted dataset, timestamps, scope ledger, exception manifest, and a reproducible destination load provide stronger evidence than the collection success percentage alone.
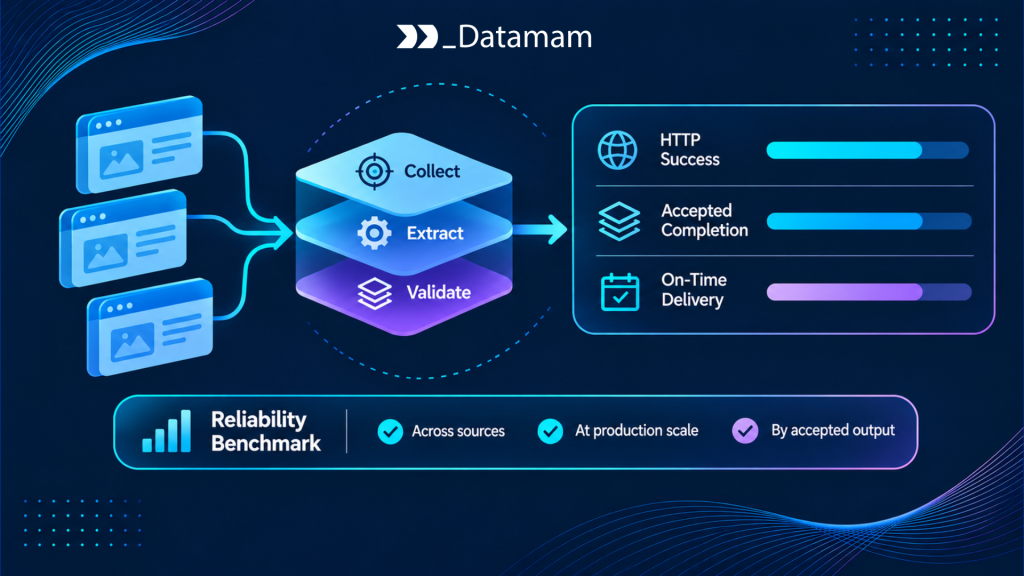
An enterprise buyer can see a scraping dashboard report 99% success and still receive misleading data. The collector may count successful HTTP responses rather than complete product observations. It may quietly omit difficult markets. Or it may publish yesterday’s accepted price as though it were today’s result. Each failure can be invisible in a request-level success rate.
This web scraping reliability benchmark examines completed, documented Datamam production workloads across airline fare searches, hotel-rate searches, and tour departure pricing. The 2027 designation is an editorial edition for planning and evaluation; the figures come from supplied operating records available by November 2026. They do not represent observations collected during 2027, an independent audit, a random industry sample, or performance promised for another source estate.
The comparison is deliberately narrower than a claim about the whole scraping industry and more useful for procurement. It defines the work being measured, shows the outcomes, identifies where business data can become wrong, and provides a reproducible standard for evaluating a managed web-data provider.
What the Production Benchmark Measures
Scheduled business jobs as the primary denominator
The measurement unit is the scheduled business job: a commissioned observation with a defined source, market or item context, collection window, and acceptance rule. In an airline program, one job can mean a route, departure date, booking conditions, source, and market profile. In hotel monitoring, it can mean a property, stay dates, room occupancy, booking context, and source. A tour job may mean a listing and a specified participant configuration for one departure.
A business job can generate multiple HTTP requests, and one valid job can return several accepted offers or no eligible offers at all. Dividing successful requests by total attempts therefore does not answer the customer’s question. The useful service-level indicator is the fraction of eligible scheduled jobs with an accepted terminal outcome available to the consumer by the required deadline. This approach is consistent with Google’s service-level objective guidance, which recommends defining indicators around the behavior users actually need, rather than choosing whatever infrastructure metric is easiest to collect.
Formally, for a defined cohort, on-time accepted completion = accepted jobs available by their assigned deadlines / eligible jobs due. Recovery-cutoff completion uses the same denominator, but allows accepted late outcomes before the separately specified cutoff. An honest report shows the counts as well as rounded percentages.
Separate airline, hotel, and tour cohorts and their deadlines
The supplied Datamam project records document distinct 30-day operating cohorts. Each was followed through a 48-hour recovery period while preserving the original completion deadlines.
| Production workload | Eligible scheduled jobs | Original completion window | On-time completion | Final completion after recovery |
| Airline fare searches | 19,564,667 | 12 hours | 99.17% | 99.83% |
| Hotel property searches | 68,263,837 | 8 hours | 99.31% | 99.81% |
| Tour departure-price searches | 8,598,473 | 12 hours | 99.24% | 99.72% |
The exact outcome counts make the percentages auditable rather than decorative. Airline searches produced 19,402,184 on-time outcomes, 130,044 late accepted outcomes, and 32,439 unresolved outcomes. Hotels produced 67,792,461 on time, 342,817 late, and 128,559 unresolved. Tour departure pricing produced 8,533,491 on time and 41,287 late, leaving 23,695 unresolved. Each row reconciles to its scheduled-job total. Percentages are rounded from those counts.
The tour engagement also operated separate product-metadata and search-position capture streams, with different clocks. They are not silently added to the departure-pricing denominator. A visibility snapshot due within 30 minutes cannot be judged by the same timing rule as a departure quote due within 12 hours.
Why these workloads cannot be ranked by percentage alone
A 99.31% on-time result under an eight-hour deadline is not automatically a better service than 99.17% under a 12-hour deadline. The data sources, geographic mix, validation requirements, accepted empty states, and client delivery systems differed. A source with difficult room and cancellation semantics can consume more validation effort than one publishing a single unambiguous price. A collection rate says little about that business meaning.
A defensible comparison normalizes the obligation first: which records were eligible, what qualified as completion, when the deadline began, whether delivery was confirmed in the receiving system, and which sources were commercially critical. Only then can buyers compare technical execution or operating models. These are Datamam-specific cohorts, not peer-vendor rankings and not generalized estimates of web scraping reliability in 2027.
Fix the Expected Population Before Calculating Success
Effective monitoring scope and changing source inventories
A denominator is credible only when its scope exists independently of the collector. The airline project managed routes, point-of-sale markets, source combinations, departure horizons, and booking conditions in an effective-dated configuration. Active route-source pairs increased from 7,123 to 7,181 as 119 pairs entered service and 61 were retired. Scheduled obligations followed the configuration in force for each collection window, not the end-of-month snapshot multiplied by the number of days.
This matters because customers change monitoring populations. Products become inactive, new geographies are added, source listings disappear, and priorities shift. A source registry should retain when each member became eligible, its refresh tier, and its exception state. Without those dates, two teams can calculate different denominators while believing they are measuring the same month.
Jobs due versus jobs admitted versus jobs completed
Jobs due are obligations generated by the approved scope and schedule. Also, Jobs admitted are those the scheduler actually placed into execution. Jobs completed are those with accepted terminal outcomes under the agreed data rules. Every difference requires reconciliation.
Suppose 100,000 observations were due, but a scheduler defect admitted only 96,000. Reporting 96,000 successful jobs out of 96,000 admitted creates a 100% execution rate while concealing 4,000 missing business obligations. The correct coverage rate for that illustrative case is 96%. Operationally, the provider should retain a ledger connecting effective scope, due-window identity, scheduler admission, final state, acceptance, and publication.
A missing job should not be silently excluded just because no network attempt was made. Likewise, an additional retry is not an additional obligation. Record the original business-job identity across every attempt.
How omitted markets can create a misleading perfect rate
Aggregate percentages are especially misleading when a high-volume source dominates the schedule. If a service collects every record from two major retailers but stops collecting a smaller competitor that is decisive for regional pricing, the overall completion rate may remain impressive while the business decision fails.
For this reason, completeness reporting should have two independent dimensions: workload-weighted completion, which shows how much scheduled work completed, and required-scope coverage, which shows whether the commissioned sources, markets, and critical categories were represented. Per-source counts and a source registry revision should accompany every production benchmark. Zero scheduled jobs for an unexpectedly missing source is not evidence of flawless reliability.
Why HTTP 200 Does Not Establish a Correct Observation
Challenge responses and incomplete rendered results
HTTP status 200 means the server delivered a nominally successful response to a request. It does not prove that the response contains the required item, price, or search result. A challenge page, consent screen, geographically redirected page, or incomplete client-rendered shell can also arrive successfully at the network layer.
Cloudflare’s Challenge Page detection documentation describes the cf-mitigated: challenge header for its challenge responses. That is one identifiable class, not a universal indicator for every blocking system. Content acceptance still needs page-family verification, expected entities or search state, and material fields. Datamam’s documented HTML-archive project illustrates the separation: 25,000 supplied URLs produced 24,250 accepted target pages and 750 explicit exceptions. A challenge page returning HTTP 200 remained an exception rather than being counted as the requested target page.
Search context, field meaning, and accepted output
Even a real result page may answer a different question than the scheduled business job. Airline prices vary by origin, destination, travel date, point of sale, currency, cabin, passenger configuration, refund terms, baggage conditions, and carrier. A syntactically valid number captured from the wrong market is a failure of business acceptance.
The same applies to hotels: a nightly price is not automatically a total-stay price, a refundable rate is not the same product as a nonrefundable rate, and an identically named room may have different occupancy or inclusions. Acceptance therefore requires context identifiers, versioned parsing rules, meaningful missing-value states, and, where necessary, entity or product matching. A parser returning rows does not prove the client can use them.
Acquisition success, business completion, and warehouse availability
A useful reliability ledger separates at least three boundaries:
| Measurement boundary | Evidence | What it does not establish |
| Acquisition | Expected source content obtained; retrieval state retained | Correct business context or usable values |
| Business-job acceptance | Required context, fields, and terminal status validated | Consumer has received or loaded the result |
| Consumer availability | Accepted release available under the agreed query or file contract | Every accepted field is accurate without a separate quality review |
For a warehouse-delivered feed, a successful object-storage upload is not enough. A batch may fail schema validation or a downstream merge. Google Cloud’s BigQuery batch-loading guidance discusses batch processing to fixed deadlines and the atomic result of a load job. The broader delivery contract must also specify which accepted version is queryable after the load and whether a retry can produce duplicates.
The Missing-Data Trap: Completed Empty Versus Unresolved
Evidence that an eligible search truly completed
A completed-empty job is a legitimate observation that the agreed search, under its required filters, reached a complete terminal state with no qualifying result. It is not a failed attempt with a missing response. This distinction is part of the dataset, not merely a logging preference.
Acceptance can require evidence such as a terminal result indicator, finished pagination, verified selected filters, a completed search transaction, and absence of qualifying offers in the result population. A timeout, a missing content section, or an access notice cannot prove that the market had no eligible listings. Those states must remain unresolved or be separately classified.
The airline population with no qualifying itinerary
The airline cohort shows why the distinction materially changes the reported result.
| Final airline search outcome | Jobs | Meaning |
| Completed with accepted fare offers | 14,762,419 | Qualifying itineraries or fare products were accepted |
| Completed with no qualifying itinerary | 4,769,809 | The defined search completed and found no eligible offer |
| Unresolved | 32,439 | Retrieval, parsing, or context validation did not establish an answer |
| Total scheduled | 19,564,667 | Every scheduled search assigned exactly one final outcome |
Completed-empty searches were 24.38% of scheduled airline searches. Removing them from the numerator would incorrectly label a large share of correctly completed work as collection failure. Folding the unresolved 32,439 into the empty population would commit the opposite error: reporting evidence of no itinerary when the pipeline did not establish that conclusion.
Why a timeout cannot mean out of stock or unavailable
The same classification error affects e-commerce, property, and recruitment data. A failed product refresh should not become out_of_stock = true. An inaccessible rental page is not proof that the unit was leased. A timeout at a careers site is not evidence that a position closed.
In a current-state view, the last accepted record may remain visible, but its observation timestamp, freshness status, and last refresh outcome must remain visible too. If the client prefers to suppress stale values, suppression should be a documented consumer rule, not an unexplained deletion. Absence in the source is a business finding; inability to verify the source is an operational state.
On-Time Completion and Late Recovery Tell Different Stories
Original deadlines remain fixed through recovery
On-time completion answers: *Was the accepted observation available when the business needed it?* Late recovery answers: *Could the missing observation still be established afterward?* Both are valuable, but they must not share one misleading percentage.
In Datamam’s airline cohort, 19,402,184 searches met the original 12-hour windows. Another 130,044 completed during recovery. The 19,532,228 final completions produced a 99.83% recovery-cutoff result, but the on-time rate remained 99.17%. Moving the deadline after the fact would make the report easier to read and less truthful. For hotel monitoring, the analogous split was 67,792,461 on time and 342,817 late under eight-hour windows.
Late successes and residual unresolved populations
The airline cohort missed 162,483 original deadlines. Recovery established 130,044 of those outcomes, about 80.04% of the originally missed population, leaving 32,439 unresolved. Tour pricing recovered 41,287 late jobs, but 23,695 still lacked an accepted answer at the cutoff. Recovered records should retain both their original due time and their eventual acceptance time.
Whether a late result is commercially useful depends on the use case. Reprocessing an archived response can sometimes reconstruct what was observed at an earlier time. A fresh scrape performed later cannot establish an earlier market state merely by using the earlier schedule identifier. Procurement comparisons need separate reporting for deadlines met, lateness recovered, and unresolved work remaining.
Error budgets should count missed business obligations
An error budget is the number or proportion of service obligations that may miss an objective during a defined period. For a scheduled data feed, it is more informative to budget missed accepted business jobs than failed HTTP requests. The logic is compatible with Google SRE’s guidance on SLO alerting and error-budget consumption, although a batch collection service needs its own deadline-aware indicators.
For example, at 19,564,667 scheduled searches, a 0.1 percentage-point change in on-time completion corresponds to about 19,565 business searches. That is not a promise of an acceptable threshold. It shows why a superficially small rate movement can represent significant lost coverage. High-priority source or market budgets should be examined separately from the global average.
Publication Latency Ends at the Consumer
Capture, validation, and warehouse-ready timestamps
End-to-end latency begins at the defined business start or scheduled-window boundary and ends when the accepted result is usable in the agreed destination. Intermediate events explain where time went: scheduler admission, first attempt, source capture, parsing, validation, file publication, warehouse load, and accepted consumer visibility.
The airline project delivered versioned JSON Lines through Google Cloud Storage into BigQuery. Hotel rates were delivered into Snowflake. In each case, the useful completion time was accepted availability in the client’s analytics environment, not the moment an HTTP request returned or a file first appeared in storage. A destination-side schema rejection can turn technically collected data into a missed business obligation.
Interpreting p95 lag only alongside completion rates
Datamam’s documented airline p95 publication lag was 5 hours, 48 minutes, 12 seconds for searches that completed on time. The hotel p95 was 4 hours, 17 minutes, 38 seconds for the corresponding on-time population. These durations include queueing, acquisition, validation, and publication. They are not interactive search response times.
A percentile calculated only from completed jobs has survivorship bias if published alone: it excludes the jobs that missed or never completed. A fleet can appear to have a fast p95 while failing its hardest markets. Always display the measured population, on-time count, late count, and unresolved count beside latency percentiles. Percentile methods should be fixed between reporting periods to avoid introducing artificial improvements.
How old data and new data appear in current views
An analyst-facing latest-price view should distinguish the last *accepted observation* from the latest *attempted refresh*. Consider a flight price accepted at 09:00 on Monday. If Tuesday’s scheduled search fails, the record may still be valuable as history, but it is not Tuesday’s observed price. The query should expose the old observation timestamp and an unresolved Tuesday state.
If Tuesday’s search completes empty, the result is a new accepted terminal state, not a reason to keep Monday’s fare as current inventory. If a parser later corrects Monday’s captured evidence, the data revision should identify the correction rather than inventing a Monday price movement. This separation supports trustworthy change detection and prevents production incidents from masquerading as business trends.
Data Accuracy Is a Separate Quality Measure
Sampling airline fare interpretation and market context
Accepted completion establishes that a job met its delivery contract. Accuracy asks whether the values describe the intended entity, source evidence, and commercial conditions. These are different populations and cannot be collapsed into one rate without a defined joint sampling design.
The airline program accepted 72,418,963 fare observations. A stratified review of 12,500 accepted fares identified 26 discrepancies: 11 market-context discrepancies, nine price-inclusion errors, and six carrier or itinerary mapping problems. Observed agreement was 99.79% in that reviewed sample. The number is not a guarantee about every fare and does not include the 32,439 unresolved business jobs. Stratification matters because difficult markets and fare conditions are not necessarily distributed like the easiest, highest-volume records.
Hotel identity, room matching, and rate inclusion
The hotel workload recorded separate reviews for three layers of correctness:
| Hotel quality review | Reviewed units | Discrepancies | Observed agreement |
| Property identity | 2,500 approved mappings | 3 | 99.88% |
| Room equivalence | 8,400 accepted relationships | 37 | 99.56% |
| Rate interpretation | 11,250 accepted rate observations | 41 | 99.64% |
The layers are not interchangeable. Correctly identifying a hotel does not prove that two rooms are equivalent. Correctly matching a room does not prove that a displayed price includes taxes, breakfast, or cancellation privileges on the same basis. An accuracy claim needs its reviewed grain, inclusion criteria, discrepancy definition, and remediation path.
ISO/IEC 25012’s data quality model provides a broader framework for defining data quality requirements and measures across acquisition and integration. Applied to web data, those dimensions must be translated into the actual customer’s field meanings rather than cited as proof that a particular feed has met a standard.
Why accepted comparisons exclude incompatible offers
A valid source observation is not automatically a valid comparison against another source. In the airline project, 8,413,287 candidate pair checks entered the comparison stage. 140,217 were outside the 90-minute observation alignment window; 71,607 had incompatible or insufficient fare conditions. The remaining 8,201,463 passed comparison rules.
These exclusions are evidence of applied quality controls, not scraping failures and not a reason to inflate the accepted comparison count. A lower price without equivalent baggage or refund terms can be a legitimate source observation but a misleading price-gap claim. Reliability must preserve the distinction between *collected*, *accepted*, *comparable*, and *actionable*.
Which Failure Classes Can Actually Be Recovered?
Retrieval, parser, and market-context failures
The airline cohort’s 32,439 unresolved searches were classified as 18,493 retrieval failures, 9,217 parsing failures, and 4,729 market or itinerary-context validation failures. That classification determines the next engineering action.
Retrieval failures may permit bounded retries or a lawful access-method review. Parser failures require inspecting the captured evidence and correcting extraction logic. Context failures require establishing whether the result actually matches the commissioned country, passenger, currency, or itinerary. Repeated network calls do not repair a deterministic parser bug; a syntactically valid price does not repair the wrong point of sale.
Retry counts versus successful recovered jobs
The airline workload generated 58,347,291 initial HTTP requests and 4,127,863 retry attempts, a total of 62,475,154 requests across collection and recovery. That means retries were about 6.61% of all HTTP attempts, but it does not mean 6.61% of business jobs failed or recovered. Several requests and retries can belong to one search, and some successful recovery involves reparsing stored evidence rather than fetching again.
AWS’s engineering article on timeouts, retries, backoff, and jitter explains why unbounded, synchronized retries can worsen overload. The relevant collection controls are source-specific dispatch limits, attempt budgets, deadline awareness, and failure-class decisions. A redesigned page cannot be made correct by issuing more copies of the same incompatible request.
Retained evidence, targeted repairs, and release replay
Recovery can occur at different layers. Retained response content can support parser regression tests and, where legally and technically possible, reconstruction of the captured historical observation. A failed delivery can be replayed using the same release identifier and stable business keys. A new collection creates a later observation that must not be backdated.
Datamam’s airline release manifests recorded cohort, schema version, count, checksum, and delivery identifier. Staging and merge logic supported replay without appending duplicates. The project used a seven-day lifecycle for raw response evidence; another industrial takeover retained delivery history for at least 30 days. These are different kinds of retention serving different recovery needs, and neither is a general retention commitment for other contracts.
Source-Level Coverage Can Be More Important Than the Fleet Average
Critical markets hidden by volume-weighted totals
Suppose a data team monitors a high-volume national marketplace and a lower-volume supplier that uniquely serves one region. Failure at the smaller supplier may have a minor effect on fleet-wide percentage but a major effect on the regional product decision. That risk is not captured by a single aggregate completion percentage.
Report outcome counts by source, market, priority tier, field contract, and data-product stream where they materially affect use. A correct overall rate with an absent mandatory market is not a satisfactory business result. A separate minimum threshold or mandatory coverage condition for critical sources can prevent a large healthy population from hiding a small but decisive outage.
Containing failure within a 200-website portfolio
Datamam’s documented weekly collection portfolio covered 200 websites and 4.6 million records per full weekly sweep. Source-specific contracts and adapters allowed one redesigned website to enter recovery while 199 healthy source deliveries continued. The affected source remained visibly incomplete rather than forcing the entire weekly release to fail or being silently treated as complete.
That design illustrates a transferable reliability principle: isolate the failure domain to the smallest meaningful source contract and publish healthy, valid work with an explicit incomplete-source status. It does not establish that every 200-source portfolio will achieve the same numbers or deadlines. Source coupling, downstream dependencies, and contractual release rules still determine whether partial delivery is acceptable.
Consumer-side source completeness and revision identity
A successful collection portfolio needs a consumer-verifiable manifest connecting every accepted source release to its expected population, schema version, file identities, checksums, record counts, and collection window. A receiving application must be able to distinguish a complete estate release from a partial one and identify which source was recovered later.
Stable release identity also prevents duplicate publication. If one source’s parser is revised, the corrected delivery should retain the affected observation’s business identity and revision history, rather than appear as an unrelated newly discovered item. These controls are particularly important when downstream business teams aggregate records across sources without inspecting every source-specific exception manually.
What an Enterprise Buyer Should Demand as Benchmark Evidence
A traceable scope-to-job-to-release ledger
A vendor’s percentage becomes assessable when a buyer can reconcile approved scope → jobs due → jobs admitted → accepted on time → accepted late → unresolved → delivered release. Ask for representative evidence that includes effective dates for added and retired sources, terminal status codes, original deadlines, and warehouse or destination acceptance timestamps.
Request both overall and critical-source slices. The denominator should remain stable after the fact except for documented, effective-dated corrections. If a vendor cannot show why a job was excluded, a nearly perfect completion rate may simply reflect an incomplete work register.
A sampled accuracy review and independent exception taxonomy
Require a quality review that covers the field semantics your business depends on. A retail feed may need units, seller, currency, pack size, and delivery terms. Hotel data may require room equivalence and cancellation conditions. Airline data may require point-of-sale and baggage interpretation. Ask for sampling populations, difficult-case representation, discrepancy classifications, reviewer decisions, and correction records.
A provider should also report failures separately: inaccessible source, incomplete search, parser regression, inconsistent market context, invalid output schema, and destination rejection. The absence of an explicit exception should not be taken as evidence of successful data collection.
A delivered partition that loads under the receiving schema
The ultimate proof is a representative release that the buyer can load under its actual data contract. Verify column types, record grain, identifiers, null semantics, source provenance, status codes, timestamps, and replay behavior. A JSON file can be syntactically valid while containing nested values the warehouse consumer cannot interpret. A Parquet partition can be technically loadable yet contain the wrong commercial context.
Ask the provider to replay one accepted batch, replace one corrected record without multiplication, and show how a missing source appears in the consumer’s data view. Those demonstrations expose integration and recovery risks that an HTTP-success dashboard cannot. The goal is not to obtain a universal success-rate promise, but to make the actual service obligation measurable and inspectable.
For recurring external data that must meet defined source coverage, acceptance, and delivery windows, discuss your production data requirements with Datamam.
Frequently Asked Questions
What is a useful web scraping success rate for an enterprise?
A useful rate is the percentage of eligible business jobs that reach an accepted consumer-visible outcome within the agreed deadline, reported with exact counts. There is no universal defensible number independent of source scope, cadence, source difficulty, and output rules. Datamam’s three documented cohorts ranged from 99.17% to 99.31% on time, but those historical observations are not guarantees or industry averages.
Why does a successful HTTP response not prove scraping reliability?
Because the response can contain an access challenge, an incomplete result, the wrong geography, or values with incorrect business meaning. Reliability requires the expected data to pass content and context validation and reach the agreed consumer destination, not merely arrive as bytes from a server.
Should a valid zero-result search count as successful?
Yes. If the requested search completed under the approved filters and established that no qualifying result was present, it is an accepted completed-empty job. A timeout or partial page is not a valid zero-result answer and must remain unresolved until sufficient evidence is available.
How does on-time completion differ from recovery-cutoff completion?
On-time completion counts accepted jobs delivered by their original deadlines. Recovery-cutoff completion also includes later valid results before a separate recovery limit, using the same eligible-job denominator. Recovery improves completeness but cannot retroactively make a missed business deadline on time.
Can two vendors’ scraping success percentages be compared directly?
Only when both percentages measure equivalent scheduled populations, deadlines, required fields, accepted-empty rules, exception treatment, and consumer availability. A request success rate and a delivered-business-job completion rate are not comparable measures. Evidence should include source-level and quality-review information, not only the headline percentage.
What evidence should support a web scraping reliability benchmark?
At minimum: an effective-dated source registry, expected-job ledger, accepted outcomes and unresolved taxonomy, deadline timestamps, destination manifests, quality-review samples, and a replayable release. For first-party benchmarks, reporting periods, cohort selection, measurement limitations, and the absence or presence of independent verification should also be explicit.