
Key Takeaways
- The collection bill is not the full operating cost. A US-based planning model for a defined internal scraping operation totals approximately $56,820 per month, including $9,500 in infrastructure allowances and the engineering, platform, and QA work needed to use the data.
- Cost comparisons need the same deliverable. Requests, scheduled business searches, accepted output records, and usable warehouse releases are different units, often with different owners.
- Refresh frequency can dominate catalog size. In a Datamam retail workload, 5% of accepted product mappings generated approximately 46.2% of daily scheduled observations because those mappings refreshed every four hours.
- Recovery is real operating work, but not every retry has business value. One airline cohort required 62,475,154 HTTP attempts to support 19,564,667 scheduled searches and accepted 72,418,963 fare observations.
- The calculated managed-fee ceiling is not a price quote. Under the stated six-month scenario, the modeled break-even ceiling is approximately $46,925 per month after retained internal work and transition costs. A buyer must replace every assumption with its own scope and costs.
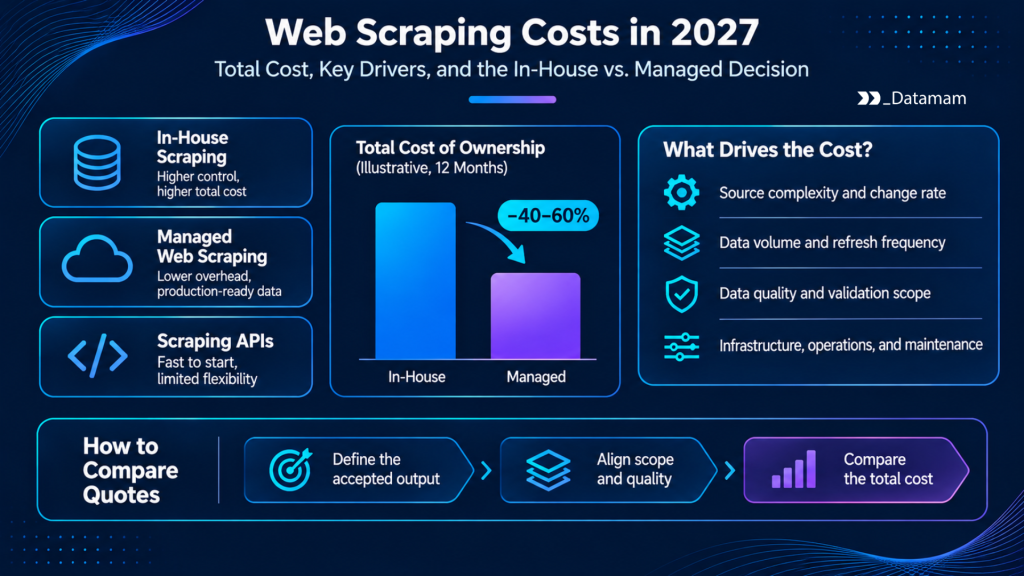
Web scraping costs depend on what an organization must receive, not simply how many URLs it intends to collect. A request to retrieve a web page can be inexpensive while the recurring work around it is not: finding complete source populations, resolving product identity, maintaining changing parsers, validating business conditions, recovering missed runs, and delivering records into the application that uses them.
The practical comparison for 2027 planning is between an internal operating team, a collection API plus the work your team retains, and a managed service responsible for a specified data output. This article uses publicly reported 2025 US occupation wages, 2026 compensation data, stated infrastructure assumptions, and Datamam production project records. The 2027 label is a planning horizon, not a claim that future operating results or future prices have already been observed.
Compare the Same Data Deliverable, Not the Same Request Count
Scraping tools, collection APIs, and managed feeds include different work
A scraping library gives engineers code-level capabilities. A collection API may provide managed request execution, browser handling, or extraction functions. A managed web-data feed can include the recurring work of source discovery, parsing, normalization, validation, maintenance, and delivery.
However, transitioning from an in-house scraping operation to a managed service also involves web scraping migration costs, including source onboarding, parallel testing, identifier reconciliation, and downstream system integration. These transition expenses should be evaluated separately from recurring service fees when comparing total operating costs. The boundaries are provider- and contract-specific, but these are not interchangeable purchases.
| Operating option | What the buyer chiefly receives | What the buyer must still operate unless separately contracted |
| Internal team | Direct control over the entire collection and processing operation | Source access, engineering, monitoring, QA, delivery, on-call response |
| Collection API or extraction platform | Specified request, browser, or extraction capabilities | Business schema, scheduling, matching, validation, downstream availability, many source-specific changes |
| Managed data feed | Recurring output and operating obligations specified in a contract | Business definitions, approval, retained integration, decisions outside the agreed service boundary |
An invoice for one million successful requests does not tell a buyer how many accepted competitor prices arrived on time. Likewise, a managed monthly fee can look expensive beside request credits while replacing multiple ongoing engineering responsibilities. Compare like for like before discussing value.
Define the source, field, schedule, and acceptance contract before pricing
A credible price comparison begins with a written data requirement. Specify the approved source registry, record grain, mandatory fields, comparable market conditions, update schedule, delivery deadline, destination, exception treatment, and retention. For a retail offer, “price” may not be enough. Currency, quantity, seller, discount eligibility, availability, and shipping context can materially change the interpretation.
Hold this contract constant across alternatives. If one quote excludes entity matching or reports only page captures, that is a different scope. If another promises four-hour updates while the baseline uses weekly checks, it is a different workload. The difference should appear as a separately priced or internally staffed responsibility, not as a silent advantage for whichever proposal has the lowest headline number.
Separate requests, business jobs, and accepted output records
Three ledgers answer different questions. A request ledger counts technical attempts and infrastructure consumption. A business-job ledger counts the observations the customer commissioned under specific markets and deadlines. An accepted-output ledger counts rows or completed-empty outcomes that met the business rules. A fourth boundary may be needed for when the receiving system made those outputs available.
Datamam’s airline program provides an observed example: 19,564,667 scheduled searches led to 58,347,291 initial HTTP requests and 4,127,863 retry attempts, or 62,475,154 attempts altogether. The accepted fare export contained 72,418,963 observations, while searches with no qualifying itinerary were tracked separately. None of these totals should be divided into a supplier rate without first checking what the supplier bills for.
What Costs Belong in an Enterprise Web Scraping Budget?
Initial implementation and source onboarding
One-time setup includes source feasibility, enumeration strategy, parser development, identity and schema definitions, representative sample collection, QA fixtures, release automation, and connection to the destination. Some projects also need controlled proof-of-concept runs, permission review, field-mapping workshops, or acceptance testing with an existing consumer.
Treat setup as a distinct cash and staff requirement. A source that appears straightforward in a single browser session may require more work to cover pagination, country variants, changing product options, incomplete result states, or repeated collection windows. New sources can demand further onboarding even after a provider has built the general pipeline.
Recurring engineering, platform support, QA, and infrastructure
Recurring operating cost has two major groups: people and processes and technical usage. Engineering maintains adapters and source mappings, responds to incidents, and revises extraction rules. Platform support manages scheduling, monitoring, deployments, and delivery. QA evaluates schema, field meaning, coverage, source-specific anomalies, and correction requests.
Infrastructure may include request services or network access, browser execution, compute, storage for source evidence and output, monitoring systems, and data transfer. The actual mix depends on source behavior. A heavily rendered travel-search workload is not priced like a set of static documents. An existing internal platform can also change marginal costs substantially.
To avoid double counting, assign a person’s maintenance and incident hours to that staff allocation once. Do not add the same labor again as an “incident cost.” Separately, model material business interruption only when there is evidence for its value and a clear probability or scenario.
Migration, parallel operation, and consumer integration
Switching from internal collectors to a managed service rarely consists of turning off old jobs and turning on new ones. Buyers may need parallel comparisons, source-by-source acceptance, identifier reconciliation, new load jobs, temporary dual operation, and rollback plans. Those costs may be one-time even though they occur during the first recurring service months.
Datamam’s industrial catalog takeover preserved the existing consumer contract as 56 source integrations and 6.8 million source items moved into managed collection. Parallel source releases were checked for identifier stability, price meaning, coverage, and exception categories. The purpose of that effort was continuity, not a larger count of scraped pages. Migration cost belongs in the business case even if the proposed monthly service fee excludes it.
A US-Based Monthly Operating Model for 2027 Planning
Loaded engineering and QA allocation assumptions
The US Bureau of Labor Statistics May 2025 occupational wage table reports mean annual wages of $148,100 for software developers and $111,490 for software QA analysts and testers. These are national occupation averages, not a salary survey of specialist scraping engineers. The BLS June 2026 employer compensation release reports wages as 68.5% of total compensation for full-time private-industry workers.
As a planning assumption, dividing the annual wage by 12 and by 0.685 yields approximately $18,017 per month for one loaded developer FTE and $13,563 per month for one loaded QA FTE. This combines two different BLS populations to create a transparent budgeting proxy. It is not a BLS estimate of the actual employer cost of an individual data engineer. Replace it with regional staffing and benefits costs whenever they are available.
The model allocates two developer FTEs to collection and maintenance, one-quarter of a developer FTE to platform operation, and one-half of a QA FTE to validation. Staff contributing only part of their time count as fractional FTEs. The model does not equate the number of people who ever touch the service with full-time staffing consumed by the project.
Collection access, compute, storage, transfer, and monitoring allowances
The infrastructure figures below are stated monthly planning allowances, not observed Datamam bills or quoted supplier rates. Together with the specified staffing, they produce the operating baseline:
| Monthly cost component | Allocation or assumption | Monthly amount |
| Collection and maintenance engineering | 2.00 loaded developer FTEs | $36,034 |
| Platform engineering | 0.25 loaded developer FTE | $4,504 |
| QA and data validation | 0.50 loaded QA FTE | $6,782 |
| Collection and network access | Allowance | $5,500 |
| Compute and browser execution | Allowance | $2,200 |
| Evidence and delivery storage | Allowance | $900 |
| Monitoring services | Allowance | $400 |
| Additional delivery transfer | Allowance | $500 |
| Total recurring operation | Before setup and migration | $56,820 |
The annual equivalent is about $682,000 before initial work. Labor contributes approximately 83% in this specific model; infrastructure contributes $9,500. That relationship explains why a modest cloud optimization might matter less than eliminating recurring manual maintenance. It does not imply that labor dominates every web scraping operation. A usage-heavy extraction service with an existing team could have the opposite cost profile.
Which assumptions require replacement with a buyer’s actual costs
Before treating the figure as a budget, replace the staffing allocation, loaded compensation, infrastructure consumption, and scope. A real program may need different coverage across time zones, more specialized engineering, no browser rendering, vendor-supported request infrastructure, different storage retention, or more expensive cross-cloud transfer. International teams also face different wage and benefit structures.
Test sensitivity by changing one input at a time. At the model’s loaded wage, another 0.5 developer FTE adds approximately $9,009 per month, even if request volume stays constant. A change to source behavior or refresh cadence may instead affect network and browser spend sharply. The model is useful because those drivers are visible and replaceable, not because $56,820 is a universal industry price.
Why Infrastructure Cost Depends on Source Behavior
HTTP retrieval versus browser execution and session steps
A target URL is not a stable billing unit. One business observation may require a direct HTTP response, a rendered browser session, several pagination calls, or a search that waits for asynchronous results. These paths consume different amounts of CPU time, connection occupancy, and transfer. Sending more concurrent requests does not necessarily improve the number of accepted observations if the source is rate-limited or the required fields have not yet appeared.
Current Zyte API pricing documentation illustrates the difference. It separates HTTP and browser request tiers, bases costs on target website and selected features, and specifies additional charges for capabilities such as actions and extraction. It also states that its request billing applies to successful responses. These are product-specific rules, not a benchmark for all providers or a proxy for an accepted business row.
The buyer should meter useful completed observations alongside browser execution time, source-session attempts, and transfer. If a single search needs several retrieval steps, a per-request model must account for each step before comparing it with the cost of an accepted search outcome.
Retries, response size, and successful output are different billable units
Retries increase technical activity without increasing the number of distinct scheduled business jobs. In Datamam’s airline cohort, 4,127,863 retries were 7.07% of the 58,347,291 initial HTTP requests. That figure measures extra request work, not the percentage of failed business searches that recovered. Some searches required several attempts; other recovery replayed saved evidence.
The source response bodies transferred during the collection and recovery work totaled approximately 9.87 TB, while the logical uncompressed accepted fare export was approximately 136.85 GB. The larger acquisition volume reflects the material processed to produce business observations. The accepted export describes a different boundary. Comparing only the smaller final dataset with a cloud storage price would understate collection cost; treating the raw transfer as accepted customer records would overstate delivered value.
Source-body transfer, compressed retained evidence, and warehouse storage should be accounted for separately. Each has different retention, compression, and billing characteristics.
Throughput limits and wasted work during source incidents
More worker capacity cannot resolve every source failure. A broken parser, a changed field meaning, or an inaccessible response template can cause thousands of similar attempts to fail for the same deterministic reason.
Web scraping schema drift can also cause less visible failures, where requests succeed but changes in page structures or field definitions produce incorrect or incomplete records. A reliable scraping benchmark should therefore measure how quickly these issues are detected, corrected, and reprocessed, rather than relying solely on successful requests. Once recognized, the useful response is to isolate the source, preserve diagnostic material, adjust the parser or access plan, and continue healthy work elsewhere.
The AWS guidance on timeouts, retries, and backoff with jitter explains why synchronized retry traffic can amplify load on a struggling dependency. For enterprise collection, bounded retries should also respect the remaining business deadline. A late response may be suitable for historical correction while being too late for the original pricing decision.
How Refresh Frequency Changes Cost Without Adding Products
Retail inventory versus scheduled observation volume
Catalog size describes how many entities are monitored. Refresh frequency describes how often business observations must be collected. They are not interchangeable. A million products checked weekly is a different operation from a much smaller priority set checked every few hours.
Datamam’s retail pricing service retained 1.2 million catalog SKUs and 4.8 million accepted product-to-retailer mappings across 12 integrations. The mappings were the relevant monitored relationships. Each mapping belonged to a defined refresh tier, rather than every possible product-source combination being fetched at the same frequency.
Priority, daily, and weekly tiers in one catalog
The production schedule divided those accepted relationships into three non-overlapping groups:
| Refresh tier | Accepted mappings | Interval | Scheduled observations per day |
| Priority | 240,000 | Every four hours | 1,440,000 |
| Regular | 1,200,000 | Daily | 1,200,000 |
| Stable | 3,360,000 | Weekly, spread across the week | 480,000 average |
| Total | 4,800,000 | Mixed | 3,120,000 average |
The priority population was 5% of the active mappings but generated approximately 46.2% of scheduled daily work. Across 30 days at this tiered schedule, that represented 93.6 million observation jobs. The design concentrated expensive freshness where the commercial decision justified it and preserved wider catalog coverage at a lower cadence.
This schedule also separated mapping discovery from repeated price checks. When a URL was reused or a pack changed, only the affected relationship needed review. Repeating full entity discovery on every short refresh would increase work without necessarily producing additional valid prices.
The cost effect of moving mappings into a faster tier
The model shows how a seemingly small scope change can alter operating volume. Move 240,000 mappings from weekly checks to four-hour checks, keeping the total catalog unchanged. Their weekly workload rises from 240,000 observations to 10,080,000, adding 9,840,000 checks each week. Total weekly scheduled work moves from 21.84 million to 31.68 million, an increase of about 45.1%.
That is a workload sensitivity, not a claim that cloud invoices will rise by exactly 45.1%. Actual spend depends on response sizes, source-specific steps, retries, available capacity, and whether the pricing model is fixed or usage-based. It nevertheless demonstrates why a quote should distinguish catalog coverage from observation cadence.
Maintenance and Recovery Are Operating Costs, Not Edge Cases
Source redesigns and field-meaning corrections
A collection pipeline can pass syntax checks while publishing incorrect business meaning. A discounted offer may become available only to members. A displayed figure can switch from a unit price to a pack price. A hotel rate can stop including a mandatory charge. Each change may require source review, parser updates, approval of interpretation rules, sample QA, and potentially revision of historical comparisons.
The industrial catalog takeover illustrates the operating responsibility. Its source adapters preserved an existing customer schema and supported daily price and availability checks for a 340,000-item priority population. During a vendor-template change, the affected source and field contract could pause while other sources continued. The budget must fund that controlled handling, not just the initial parser build.
Retained evidence, selective replay, and bounded retries
A well-designed repair process distinguishes recollection from reinterpretation. In production data pipelines, scraper failure recovery requires identifying whether missing or incorrect records need new collection attempts, reprocessing of retained responses, updated parsing logic, or downstream delivery repairs.
These recovery methods should be tracked separately to measure how effectively the pipeline restores data completeness, accuracy, and reliable delivery. Reprocessing a response captured yesterday may fix a historical parser mistake without inventing a new price observation. Fetching the page again today produces evidence about today, not yesterday. A destination load replay should use stable release keys so that a repeated batch does not append duplicate records.
Retention creates a cost tradeoff: raw responses consume storage, but retaining a bounded period of source evidence can prevent expensive broad recollection after a parser defect. The airline workflow used a seven-day raw-response lifecycle; the industrial migration retained delivery history for at least 30 days. Those are separate documented project policies, not a recommendation that every customer use either period.
Keeping invalid or stale records out of business output
Failure must not masquerade as a commercial event. An unsuccessful product refresh does not prove a stockout. An incomplete hotel search does not prove that every room is sold out. A late fare cannot be backdated to a missed search window. Reliable operating systems preserve explicit missing, late, stale, and unresolved states.
These protections require testing and support even when they reduce the number of rows the service can report as accepted. A lower apparent output count may actually mean stronger quality control. Budget the time needed to implement, explain, and recover those decisions rather than rewarding the cheapest row count.
Include the Work Required to Make Data Usable
Identity matching and comparison rules
Business value often depends on matching records across sources. A catalog SKU may correspond to several retailer offers. Two rooms may have similar labels yet differ in bed configuration or cancellation policy. Two fares may refer to the same flight but use different currencies, baggage terms, or membership conditions. Collecting both rows does not make them comparable.
The operating budget should therefore include match-candidate discovery, approval rules, evidence retention, treatment of ambiguous cases, and revision of relationships when source attributes change. These tasks can be performed internally or purchased within a managed scope, but they do not disappear simply because an API successfully returns page data.
Validation and the receiving system’s actual data contract
An export with correct syntax can still be incompatible with the consuming application. Datamam’s national physician-data engagement initially delivered 26 alphabet-partitioned files after discovering approximately 1.35 million profile URLs. The consumer then required JSON arrays rather than JSON Lines, followed by string-compatible projections of three nested fields. The second compatibility change was delivered in 1 hour 55 minutes.
The lesson for budgeting is concrete: define the format the actual reader accepts, not the format an extraction team happens to generate. Include schema review, null behavior, nested relationships, date handling, and acceptance testing against the target system. A nominally complete collection that cannot load is unfinished work for the buyer.
Correction, reconciliation, and accepted warehouse availability
A production release needs more than a file count. Manifests, checksums, schema versions, record identifiers, and destination reconciliation make it possible to prove which accepted records arrived and which did not. When a correction is published, the receiving system should distinguish a revised interpretation from a fresh business observation.
Reprocessing is particularly important when a failed load or parser regression affects one source rather than a full portfolio. Source-level releases can reduce repair scope. The associated engineering and QA time belongs in total cost of ownership, even when its effect on monthly request consumption is small.
Calculate the Managed-Service Break-Even Point
Subtract retained internal work and amortized transition from the baseline
A fair break-even test compares the ongoing cost of the existing operation with the managed fee plus any work the buyer will keep. Using the $56,820 monthly model, assume the managed contract accepts responsibility for defined collection, maintenance, validation, and delivery. The buyer retains one-quarter developer FTE and one-quarter QA FTE for business definitions, acceptance, and integration, worth approximately $7,895 per month under the same wage assumptions.
Assume also $12,000 in one-time transition work evaluated over six months, or $2,000 per month. For this scenario, separately billed infrastructure is assumed to be included in the managed fee. The monthly calculation is:
Managed-fee break-even ceiling = current internal recurring cost − retained internal recurring cost − transition cost allocated per month − separately retained infrastructure.
| Scenario component | Monthly amount | Treatment |
| Current internal operation | $56,820 | Cost baseline |
| Retained internal labor | $7,895 | Remains with buyer |
| Transition allocation | $2,000 | $12,000 over six months |
| Illustrative managed-fee ceiling | $46,925 | $56,820 − $7,895 − $2,000 |
The ceiling changes with the evaluation period, scope, and retained work. For example, leaving additional cloud services outside the provider’s fee would lower it. Extending the evaluation period would spread a one-time transition allowance differently. The buyer should model those changes explicitly.
Treat a modeled threshold differently from a vendor price
The $46,925 figure is neither a market-average fee nor a Datamam quote. It is the mathematical maximum recurring fee for which the managed option would be no more expensive than the defined internal baseline over the stated horizon, given equivalent operating results. A source estate requiring different coverage, countries, output definitions, or service windows needs its own calculation.
If the managed proposal excludes entity matching, historical corrections, or consumer-ready delivery, the buyer must add the internal work required to provide those capabilities. If the proposal includes materially stronger coverage or different deadlines, the comparison must identify and value the difference rather than treating all outputs as equivalent.
Separate avoidable cash expense from released engineering capacity
An employee whose time is released does not automatically leave payroll. The business may receive capacity to build products, improve analytics, or reduce dependence on contractors, but those effects are not the same as immediate cash savings. Likewise, a fixed infrastructure commitment may remain payable after collectors are retired until the contract renews.
A useful decision model separates avoidable invoices and staffing expense, reassignable engineering capacity, transition work, and service-quality consequences. It can then distinguish a genuine budget reduction from a strategic decision to redeploy experienced engineers to higher-value work.
Compare Unit Economics Against Accepted Observations
Define acceptable rows and complete-empty outcomes
“Cost per record” is meaningful only when the record definition is stable. For a product, acceptance may require a verified mapping, the correct currency and pack, a valid price condition, and availability at the consumer boundary before the agreed deadline. For a flight search, success may produce several accepted fares or a valid completed-empty status. An unresolved search produces neither an accepted fare nor evidence of a valid absence.
Do not mix accepted output rows with completed business jobs in one denominator. Both are useful, but they answer different questions. A large number of extracted rows can look economical while missing a critical retailer or producing values under the wrong geography.
Cost per thousand accepted observations and required source coverage
As a worked planning sensitivity, if an operation costing $56,820 per month delivers eight million accepted business observations, the implied cost is about $7.10 per thousand accepted observations. Eight million is an explicitly selected model input, not the measured output of the staffing scenario or a published Datamam rate.
A procurement review should compare unit cost alongside required source coverage, on-time completion, validated empty results, accepted field coverage, and warehouse availability. A cheaper provider with weak coverage of the business-critical 10% of the source estate may impose a higher commercial cost than the average unit metric suggests.
Why cheap requests can produce expensive unusable data
Request economics can improve while useful-output economics deteriorate. A provider might retrieve simple pages quickly but return challenge HTML, outdated records, duplicate product variants, or prices that cannot be matched to the customer’s catalog. Those responses still consume parsing, review, and exception-handling effort.
The relevant cost is the amount spent to obtain a defensible decision input. If the dataset must be reconciled, repaired, or recollected by the buyer, include that work. A cost model focused on accepted observations makes it harder for technically cheap but unusable volume to appear successful.
Use Operational Results to Test the Business Case
Airline reconciliation workload before and after managed delivery
Datamam’s airline engagement measured recurring collection and reconciliation work across two four-week operating periods. The earlier workflow averaged 247.6 staff hours per week; the managed workflow averaged 43.1 while supporting the wider daily monitoring matrix. The difference of 204.5 hours per week was an 82.6% reduction in that specific work category.
The result does not imply an 82.6% reduction in the customer’s total headcount, payroll, or overall data budget. It measures labor consumed by recurring collection and reconciliation, and the project documentation reports broader monitoring coverage during the managed period. That is the level at which a buyer should evaluate a claimed operational gain.
Which tasks leave the team and which decisions remain
The airline feed published accepted fare observations and produced review cases linked to the source price, travel context, and comparison rules. Analysts could investigate persistent price differences without reconstructing searches from spreadsheets. Their remaining work focused on source exceptions, market settings, and commercially meaningful fare differences rather than repetitive collection.
Another buyer may retain more or less work. Pricing teams still own which competitors matter, how to interpret a price gap, and when to act. Data engineering teams still own data definitions and downstream decisions unless the contract explicitly delegates more. The business case should name the work actually transferred, the work remaining, and the capacity released.
When internal ownership, an API, or managed delivery is the better fit
An internal team is appropriate when collection methods are strategic intellectual property, requirements change continually, or the company has an established platform with sufficient staff coverage. A collection API can be efficient when the organization already maintains scheduling, parsing, validation, and destination operations and chiefly needs a request or browser capability. A managed feed is a stronger candidate when source maintenance, normalized record delivery, and recurring incident response distract the team from the product that consumes the data.
For procurement, request one representative source population, a matched acceptance contract, an operating responsibility matrix, and a cost model that includes retained labor. Price the same decision-making output across all three paths. That reveals the option’s real operating economics more reliably than a per-request comparison.
If your team is evaluating the total cost of an external-data program, contact Datamam to scope the sources, refresh schedule, and delivery responsibilities before comparing managed proposals.
Frequently Asked Questions
How much does enterprise web scraping cost per month?
There is no reliable universal monthly price without source scope, observation frequency, validation requirements, and delivery boundaries. The article’s US planning scenario totals $56,820 per month for its stated internal staffing and infrastructure allocations. It is an operating model, not a Datamam service price or an industry average. A quote should use the actual required sources and accepted output contract.
Why is a scraping API quote not comparable to a managed feed fee?
An API quote usually prices specified collection capabilities. A managed feed quote may include ongoing extraction engineering, normalization, matching, QA, scheduling, maintenance, recovery, and delivery. To compare total cost, add the work remaining with the buyer under each alternative and hold required data coverage and acceptance constant.
What is usually missing from an in-house scraping cost estimate?
Common omissions include allocated platform and QA labor, source-change maintenance, incident handling, schema adaptation, destination reconciliation, selective replay, and migration. Cloud usage is visible on invoices, while engineering effort is often distributed across several employees and teams. Include that work once, without counting the same incident hours twice.
How do update frequency and source complexity affect price?
More frequent observations create more scheduled jobs. Browser rendering, multi-step searches, regional sessions, larger responses, and retries can increase usage per job. In Datamam’s retail case, moving a 240,000-mapping group from weekly to four-hour refresh would increase total scheduled weekly observations by about 45.1% at unchanged catalog size. Actual charges depend on each provider’s billing method.
How should a buyer calculate outsourcing break-even?
Start with the recurring internal operating cost, subtract the internal work and infrastructure that will remain after outsourcing, then subtract an appropriate monthly allocation for transition. The remainder is a fee ceiling under equivalent scope and the chosen evaluation period. Check assumptions about what expenses truly disappear and what engineering capacity is only reassigned.
Can a managed service reduce headcount costs automatically?
No. Replacing an internal collection workload can free employee time, reduce contractor hours, or avoid future hiring, but payroll declines only if staffing expense actually changes. Treat released capacity as a separate benefit unless there is a documented plan for avoidable cash savings. The airline project’s 82.6% reduction concerned one category of recurring work, not total headcount.