Key Takeaways
- How IoT Data Engineering supports telemetry platforms across sensors, devices, gateways, streams, storage, and analytics systems
- Why IoT data pipelines require validation, event ordering, schema control, freshness monitoring, and device-level lineage
- How telemetry data architecture improves alert reliability, asset monitoring, predictive maintenance, and operational visibility
- Why sensor data processing infrastructure fails when teams rely on unmanaged event feeds or inconsistent timestamp logic
- How governed data engineering improves scalability, auditability, and trust in connected-device analytics
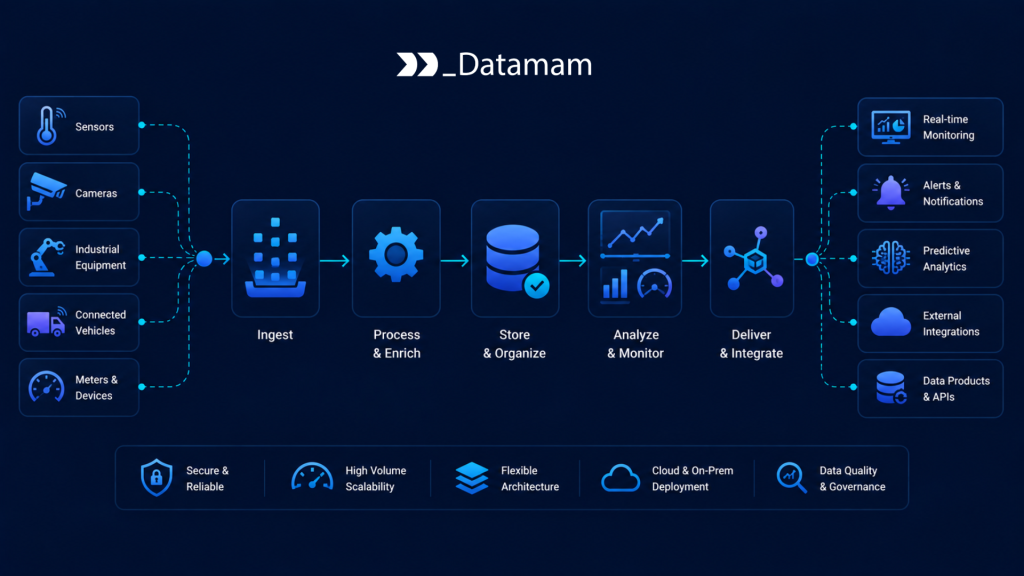
IoT and telemetry systems depend on reliable data engineering across sensors, connected devices, gateways, event brokers, time-series stores, operational systems, analytics platforms, monitoring tools, and downstream applications. When IoT Data Engineering is weak, teams face delayed device signals, missing readings, duplicate events, inconsistent timestamps, unreliable alerts, and dashboards that cannot support operational decisions. The issue is rarely only the device network. It is usually the operating layer behind telemetry collection: ingestion, stream processing, validation, normalization, orchestration, lineage, observability, access control, and governance. IoT Data Engineering gives operations, product, engineering, analytics, maintenance, security, and executive teams a structured foundation for turning high-volume sensor data into usable operational intelligence.
The Data Reliability Gap in IoT and Telemetry Systems
IoT systems generate continuous streams of operational signals. Sensors may report temperature, vibration, pressure, location, energy usage, machine status, asset movement, device health, battery level, or environmental readings. These signals can support predictive maintenance, fleet tracking, quality monitoring, safety alerts, service optimization, and real-time operations.
However, telemetry analytics is only as reliable as the engineering foundation behind it. A device may send duplicate readings. A gateway may buffer events during connectivity loss. A timestamp may reflect device time instead of server time. A sensor may drift slowly before failing. NIST Cyber-Physical Systems guidance is relevant because IoT environments connect physical systems, data flows, operational controls, and risk management.
Why Telemetry Data Becomes Difficult to Operate
Telemetry data is difficult to operate because it is high-volume, time-sensitive, and often imperfect. Devices may operate in low-connectivity environments. Sensors may send noisy readings. Gateways may batch events. Firmware versions may change event structure. Different device models may report the same metric using different names, units, or sampling rates.
Without structured IoT Data Engineering, these differences create unstable analytics. A maintenance dashboard may miss a failure signal because events arrived late. A location system may show stale asset positions. A predictive model may train on inconsistent sensor values. IoT data pipelines must normalize and validate these signals before they can support decisions.
Where Sensor Data Processing Infrastructure Breaks Down
Sensor data processing infrastructure breaks down when teams treat telemetry ingestion as a raw event capture problem. Capturing events is necessary, but not enough. Teams also need schema management, device identity mapping, timestamp normalization, quality checks, anomaly handling, retention rules, and downstream delivery controls.
At scale, unmanaged telemetry streams create operational noise. Alerts fire from bad data. Dashboards show gaps. Engineers spend time investigating pipeline issues instead of asset performance. Data engineering turns raw telemetry into controlled operational signals. Data engineering solutions for customer insights can help organizations transform their data into actionable strategies. By leveraging advanced analytics and machine learning, businesses can better understand customer behavior and preferences. This deep understanding enables targeted marketing efforts and enhances customer satisfaction.
IoT Data Engineering as an Operating Layer
IoT Data Engineering becomes valuable when it operates as a controlled layer between devices, gateways, streaming platforms, processing jobs, storage systems, analytics tools, and operational workflows. The goal is not simply to collect sensor readings. The goal is to deliver validated, ordered, normalized, and traceable telemetry data into systems that depend on it.
This operating layer should define trusted device sources, event schemas, timestamp rules, validation thresholds, retry handling, anomaly routing, storage patterns, and downstream dependencies. Without these controls, telemetry systems may produce large volumes of data without producing reliable intelligence.
Defining Ownership Across Devices, Events, and Assets
Source ownership is the foundation of reliable IoT data pipelines. Operations teams may own asset status, maintenance rules, and alert thresholds. Engineering teams may own device firmware, event formats, gateway behavior, and telemetry protocols. Product teams may own usage signals, device behavior metrics, and customer-facing device analytics. Security teams may own device identity, access rules, and anomaly monitoring.
Clear ownership prevents ambiguity. Data engineering can build telemetry pipelines, but operations teams must define what counts as a critical event. Engineering teams must confirm how firmware changes affect schemas. Security teams must confirm which device events are sensitive and how access should be governed.
Creating a Reusable Telemetry Data Model
A reusable telemetry data model connects device ID, asset ID, sensor type, metric name, unit, event timestamp, ingestion timestamp, gateway ID, firmware version, location, quality status, validation result, and lineage reference. This model does not require every IoT use case to use the same metrics. However, it does require consistent handling of identity, time, units, and source context.
For example, predictive maintenance may require vibration, temperature, runtime hours, and fault codes. Fleet operations may require location, speed, battery level, and route status. Energy analytics may require meter readings, load patterns, and equipment state. IoT Data Engineering should make these inputs reusable, tested, and explainable.
Infrastructure Requirements for IoT Data Pipelines
IoT data pipelines depend on infrastructure that can ingest, process, validate, normalize, store, monitor, and govern telemetry at scale. The objective is not to build isolated feeds for each device type. Teams need shared engineering patterns that handle high volume, delayed events, duplicate readings, schema drift, device outages, unit conversion, access controls, and audit evidence.
Telemetry data can be sensitive because it may expose asset locations, production capacity, facility operations, customer usage, energy patterns, safety events, or equipment vulnerabilities. ISO/IEC 27001 is relevant because connected-device data platforms require disciplined controls around confidentiality, access management, monitoring, and risk treatment.
Orchestrating Telemetry and Sensor Workflows
IoT data may come from embedded sensors, industrial control systems, edge gateways, device clouds, fleet platforms, mobile devices, meters, logs, and operational applications. Kafka can support high-throughput event ingestion and streaming updates. Apache Airflow can orchestrate batch enrichment, replay workflows, quality checks, retention jobs, and downstream publication tasks.
Spark can process high-volume sensor readings, device logs, location records, and historical telemetry windows. dbt can manage repeatable transformations for aggregated metrics, asset-level views, alert tables, and reporting-ready datasets. Snowflake, BigQuery, Databricks, or time-series stores can support staging, history, analytics, and operational monitoring layers.
def route_telemetry_event(event):

    if event["quality_status"] == "validated":

        return {"action": "publish_to_operations_stream", "device_id": event["device_id"]}

    if event["quality_status"] == "failed":

        return {"action": "alert_device_team", "device_id": event["device_id"]}

    return {"action": "hold_for_review", "device_id": event["device_id"]}


REQUIRED_TELEMETRY_FIELDS = ["device_id", "sensor_type", "event_timestamp", "quality_status"]


def validate_telemetry_event(event):

    missing = [field for field in REQUIRED_TELEMETRY_FIELDS if not event.get(field)]

    if missing:

        return {"valid": False, "reason": "missing_fields", "fields": missing}

    if event.get("reading") is None:

        return {"valid": False, "reason": "reading_required"}

    if event.get("battery_level") is not None and event["battery_level"] < 0:

        return {"valid": False, "reason": "invalid_battery_level"}

    return {"valid": True}


event = {

    "device_id": "DEV-48192",

    "sensor_type": "temperature",

    "event_timestamp": "2026-08-12T03:18:00Z",

    "quality_status": "validated",

    "reading": 72.4,

    "battery_level": 86,

}


print(route_telemetry_event(event))

print(validate_telemetry_event(event))
This engineering logic keeps telemetry events controlled before analytical or operational use. Validated readings can move into operations streams, failed records can alert device teams, and incomplete sensor events can be blocked before they distort alerts or dashboards.
Validating Sensor Readings, Timestamps, and Device Identity
Validation controls prevent unstable telemetry from entering operational workflows. These controls should check missing device IDs, invalid timestamps, duplicate events, impossible readings, unsupported units, stale gateway batches, firmware-schema mismatches, location anomalies, and inconsistent sampling rates.
Great Expectations can support completeness, accepted-value, freshness, uniqueness, and referential integrity checks. Data observability systems can monitor event volume, late-arriving data, schema changes, device silence, abnormal readings, and pipeline failures. Metadata catalogs can document device models, metric definitions, owners, lineage, and downstream dependencies. Data monitoring strategies for engineers can enhance the reliability of data flows by providing insights into potential issues before they escalate. By implementing automated alerts and dashboards, teams can swiftly identify and respond to data quality concerns. This proactive approach helps maintain trust in the data being analyzed and supports informed decision-making across the organization.
Technology Stack Behind Telemetry Data Architecture
Telemetry data architecture requires a technology stack that supports streaming ingestion, batch processing, validation, enrichment, storage, observability, and governance. The stack must support real-time operational use cases and historical analytics at the same time.
A mature environment connects sensors, gateways, Kafka streams, Airflow workflows, Spark jobs, dbt models, time-series databases, data warehouses, observability tools, metadata catalogs, BI dashboards, and operational alerting systems. It should reduce manual event troubleshooting without weakening device security or operational accountability. Enterprise data operations solutions play a crucial role in enhancing the efficiency of these complex systems. They streamline data workflows and enhance collaboration across teams, enabling faster decision-making. By leveraging advanced analytics and automation, businesses can unlock the full potential of their data resources.
Streaming Pipelines and Time-Series Analytical Stores
Streaming pipelines convert raw device signals into usable operational events. They may enrich events with asset metadata, facility location, customer account, firmware version, maintenance schedule, or threshold rules. This allows downstream systems to route alerts, update dashboards, trigger workflows, and support predictive models.
Analytical stores should preserve event versions, timestamps, validation results, source context, and transformation rules. This allows teams to reproduce an incident timeline, compare equipment performance over time, and investigate changes in operational metrics. In practice, this becomes critical when telemetry supports safety alerts, predictive maintenance, field service, energy optimization, or production monitoring.
Governance, Lineage, and Access Control
IoT data governance should include role-based access, audit logs, device lineage, retention rules, metadata management, source documentation, and alert versioning. These controls matter because telemetry can reveal sensitive operational patterns and asset behavior.
Data lineage should trace telemetry from device event through gateway, broker, validation, transformation, storage, alerting, and reporting. If a dashboard shows a sudden equipment spike, teams need to know whether the cause was a real sensor event, device malfunction, unit conversion issue, delayed batch, or pipeline change.
Commercial Impact of IoT Data Engineering
The commercial value of IoT Data Engineering appears when operations, engineering, product, and analytics teams can trust the timing, completeness, and explainability of telemetry data. Better engineering can reduce alert noise, improve asset monitoring, support predictive maintenance, lower manual troubleshooting, and strengthen operational visibility.
For operations leaders, product teams, field service managers, engineering teams, analytics leaders, and executives, the practical value is confidence. Integrated telemetry data architecture helps teams understand which signals are reliable, which devices are silent, which readings failed checks, and which systems depend on specific telemetry streams.
Improving Asset Monitoring and Operational Response
Asset monitoring improves when device, sensor, location, maintenance, and operational data connect through a common telemetry model. Teams can see asset health, abnormal readings, usage patterns, device downtime, and early failure indicators more clearly.
This supports faster response. Operations teams can prioritize maintenance, field service can investigate device issues, and product teams can identify reliability problems before they affect more customers or assets.
Reducing Manual Troubleshooting and Alert Noise
IoT teams often spend significant time investigating whether an alert reflects a real operational issue or a data issue. Duplicate events, delayed readings, missing device metadata, and schema changes can all create false alarms.
IoT Data Engineering reduces this burden by automating validation, normalization, freshness monitoring, and exception routing. Analysts and engineers can spend more time improving system performance and less time explaining broken telemetry.
Risk Exposure When IoT Data Engineering Is Weak
Weak IoT data engineering creates operational, commercial, and governance risk. Alerts may be triggered by bad data. Real failures may be missed. Device health dashboards may be stale. Predictive maintenance models may train on inconsistent readings. Product teams may misinterpret customer usage.
The risk increases when organizations operate across thousands or millions of devices, multiple locations, firmware versions, network conditions, and sensor types. Manual workflows may work for limited deployments, but they become fragile in enterprise telemetry platforms.
Stale Telemetry and Misleading Operational Signals
Stale telemetry creates poor decisions. A machine may appear healthy because the latest fault signal never arrived. A vehicle may appear in the wrong location because buffered GPS events were processed late. A facility dashboard may show normal usage after meters stopped reporting.
Sensor data processing infrastructure should include freshness checks, device silence alerts, replay handling, and late-event logic. These controls allow teams to identify data latency before it affects operations.
Device Security, Access, and Governance Risk
Telemetry systems connect physical assets to digital infrastructure. This creates governance risk if device identities, access rules, audit logs, or retention policies are not engineered properly. Sensitive operational data may become visible to the wrong users, or device anomalies may not be traced back to source events.
NIST SP 800-53 is useful because telemetry environments often require access control, audit logging, monitoring, and security governance across connected systems and sensitive data flows.
Evaluating IoT Data Engineering Readiness
IoT Data Engineering becomes valuable when it supports repeatable telemetry workflows, not simply when events can be captured. Readiness depends on device identity, event schemas, timestamp handling, validation controls, lineage, observability, access governance, storage architecture, and downstream dependency documentation.
A readiness review helps identify where telemetry risk accumulates before it becomes alert failure, operational blind spot, customer issue, predictive maintenance error, or compliance concern.
How Teams Assess IoT Data Quality
A structured assessment should evaluate missing device IDs, duplicate events, invalid timestamps, unsupported units, impossible readings, stale sensors, silent devices, schema drift, firmware-version mismatch, location anomalies, failed transformations, and source-to-dashboard mapping coverage. It should also review ownership, validation coverage, exception volume, lineage completeness, access controls, and alert dependencies.
For IoT data pipelines, quality must be evaluated operationally. A reading may load successfully while still failing to support alerts, asset monitoring, predictive maintenance, customer reporting, or executive dashboards.
When Organizations Need an IoT Data Engineering Architecture Review
An IoT data engineering architecture review becomes useful when teams rely on unmanaged device streams, inconsistent telemetry schemas, manual alert investigation, failed refreshes, or dashboards that do not reconcile with device reality. The review should assess source coverage, pipeline workflows, event processing logic, validation controls, storage architecture, lineage tracking, observability, governance posture, and downstream operational dependencies.
The output should clarify where telemetry data risk accumulates, where sensor data processing infrastructure may be incomplete, and which engineering improvements would make telemetry data architecture more reliable for operations, product, engineering, analytics, and executive teams.
Conclusion: IoT Data Engineering as Telemetry Infrastructure
IoT and telemetry systems depend on reliable data movement across sensors, gateways, event streams, processing jobs, storage systems, monitoring tools, analytics platforms, and operational workflows. When data engineering is inconsistent, teams spend excessive time investigating missing readings, explaining false alerts, correcting timestamps, and rebuilding trust in telemetry dashboards. IoT Data Engineering creates the governed foundation needed to coordinate IoT data pipelines across the full connected-device lifecycle.
Ultimately, organizations that treat IoT data engineering as telemetry infrastructure, not just sensor event collection, will be better positioned to improve telemetry data architecture, strengthen sensor data processing infrastructure, reduce operational blind spots, and build more reliable connected-device analytics across the enterprise.