Key Takeaways
- Data Observability Engineering gives enterprises visibility into pipeline health, data freshness, quality failures, schema changes, volume anomalies, and downstream reliability.
- A data observability framework should define what is monitored, who owns each signal, which failures trigger alerts, and how incidents are resolved.
- Pipeline health monitoring should evaluate more than job success. It should track source availability, validation outcomes, latency, freshness, retries, and downstream impact.
- Data reliability monitoring helps teams detect silent failures before dashboards, AI workflows, financial reports, customer systems, or operational processes are affected.
- Strong observability engineering requires metrics, logs, lineage, metadata, ownership, incident workflows, audit trails, and governance review.
Enterprise data systems often fail without obvious infrastructure failure. A pipeline may run successfully while processing stale data. A dashboard may refresh on time while using incomplete source records. A transformation may complete while introducing duplicate values. A schema change may pass through the pipeline but break an AI feature or downstream report later.
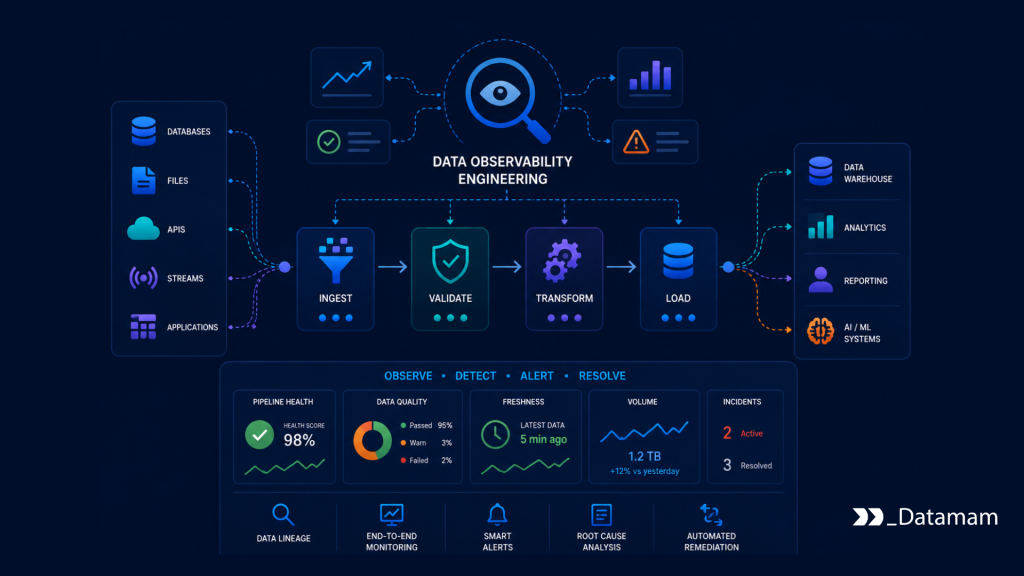
Data Observability Engineering establishes the control layer to detect these issues. It monitors whether data pipelines are healthy, whether outputs are reliable, and whether downstream systems can trust the data they consume.
In enterprise data operations, observability is not just dashboarding for engineers. It is a reliability discipline that helps data platforms support analytics, AI, reporting, finance, customer operations, healthcare analytics, IoT, and real-time decision systems without constant manual inspection.
Why Data Observability Engineering Matters at Enterprise Scale
Data Observability Engineering matters because enterprise data platforms contain many pipelines, domains, transformations, storage layers, and consumers. A single data quality issue can affect dashboards, machine learning features, revenue reporting, risk analysis, customer segmentation, compliance workflows, or executive decision-making.
Deloitte’s data observability guidance defines data observability as a technology-enabled, people-powered discipline for understanding and optimizing the end-to-end data supply chain, while emphasizing that value comes from the combination of technology, process, governance, and talent. That framing is important because observability only works when monitoring signals are connected to ownership and action.
Why Job Success Is Not the Same as Data Reliability
A pipeline job can complete successfully while producing unreliable data. The source may have delivered fewer records than expected. A required partition may be missing. A transformation may have changed category logic. A downstream table may contain records, but the records may no longer match business expectations.
This is why pipeline health monitoring cannot rely only on scheduler status. A green job status confirms execution. It does not confirm data completeness, freshness, accuracy, schema stability, or downstream usability.
Data Observability Engineering adds those missing checks. It looks at the data and the pipeline behavior together.
How Weak Observability Creates Operational Risk
Weak observability creates risk because data failures move silently. Business users may notice a dashboard discrepancy before engineering teams detect the issue. A model may receive incomplete features before the data platform flags the upstream problem. A finance team may identify reporting variance after a decision cycle has already started.
Gartner’s 2025 data and analytics trends highlight that data and analytics are becoming more embedded in enterprise operations. As data becomes operational infrastructure, weak observability becomes a business reliability issue, not only a technical monitoring gap.
Data Observability Framework Design
A data observability framework defines the monitoring model for enterprise data systems. It should specify what signals are collected, how failures are classified, who owns remediation, and how reliability evidence is preserved.
The framework should cover freshness, volume, schema, quality, lineage, latency, dependency status, and downstream consumption. Effective governance is essential for ensuring accuracy and compliance in data handling. By implementing governed enterprise data management practices, organizations can achieve greater transparency and accountability in their data processes. This structured approach facilitates timely decision-making and optimizes data utilization across the enterprise.
Defining Observable Data Signals
Observable data signals should reflect the failure modes that matter to the business. Common signals include source availability, row volume, freshness, schema changes, null rates, duplicate rates, referential integrity, validation failures, transformation duration, pipeline retries, and downstream delivery status.
A customer pipeline may prioritize identity completeness and duplicate detection. A finance pipeline may prioritize reconciliation, ledger integrity, and reporting freshness. An IoT pipeline may prioritize event volume, latency, and sensor drift. An AI feature pipeline may prioritize completeness, stability, and training-serving consistency.
The observability framework should not monitor everything equally. It should prioritize signals by data domain, consumer risk, and operational impact.
Connecting Signals to Ownership
Observability without ownership creates noise. Alerts should route to the team that can resolve the issue. Source availability failures may belong to source system owners. Transformation failures may belong to data engineering. Data contract issues may belong to producer teams. Metric definition issues may belong to business domain owners.
Ownership should be visible in metadata. Each pipeline, dataset, table, feature, and report should have a responsible owner or escalation path.
In practice, this is what turns observability from monitoring into operational control.
Classifying Pipeline Health
Pipeline health should be classified based on multiple signals. A pipeline may be available but stale. It may be fresh but incomplete. It may be complete but failing validation. A clear health classification helps teams respond consistently.
OBSERVABILITY_RULES = {

    "freshness_limit_minutes": 90,

    "minimum_record_count": 1000,

    "blocked_statuses": ["validation_failed", "schema_changed", "source_missing"],

}


def classify_pipeline_health(pipeline):

    if pipeline.get("status") in OBSERVABILITY_RULES["blocked_statuses"]:

        return {"health": "blocked", "reason": pipeline.get("status")}


    if pipeline.get("freshness_minutes", 0) > OBSERVABILITY_RULES["freshness_limit_minutes"]:

        return {"health": "stale", "reason": "freshness_limit_exceeded"}


    if pipeline.get("record_count", 0) < OBSERVABILITY_RULES["minimum_record_count"]:

        return {"health": "degraded", "reason": "low_record_volume"}


    return {"health": "healthy"}
This snippet follows the same pattern as the previous articles: define rules, evaluate the operational object, and return a clear status that can drive alerts or escalation.
Pipeline Health Monitoring for Production Data Systems
Pipeline health monitoring should show whether pipelines are running, whether data is valid, whether dependencies are available, and whether downstream systems can use the output.
This requires monitoring both pipeline execution and data behavior.
Monitoring Freshness, Volume, and Latency
Freshness shows whether data is current enough for its intended use. Volume shows whether expected records arrived. Latency shows whether the pipeline completed within the expected operating window.
These signals should be interpreted by use case. A real-time fraud pipeline may need minute-level freshness. A daily executive dashboard may tolerate longer windows. A finance close process may require specific cutoff timing rather than continuous updates.
Volume monitoring should also use context. A sudden drop may indicate source failure. A sudden spike may indicate duplication, source replay, or upstream behavior change.
Detecting Schema and Contract Drift
Schema drift occurs when data structure changes unexpectedly. A field may be renamed, removed, added, changed in type, or populated differently. Contract drift occurs when the business meaning of data changes even if the structure remains technically compatible.
Schema drift can break transformations, dashboards, feature pipelines, and reporting models. Contract drift can be even harder to detect because jobs may continue to run while their outputs become misleading.
Data Observability Engineering should detect schema and contract changes early, classify their impact, and route them to the correct owner.
Watching Dependencies and Downstream Consumers
A pipeline may depend on source systems, upstream tables, object storage, orchestration tools, APIs, queues, transformation jobs, and downstream consumers. Health monitoring should make those dependencies visible.
If a downstream dashboard is stale, teams should know whether the issue came from source delay, validation failure, transformation error, warehouse load delay, or dashboard refresh timing.
A dependency-aware observability model reduces investigation time because teams can see where reliability degraded.
Data Reliability Monitoring Across Domains
Data reliability monitoring evaluates whether data is trustworthy for operational use. It looks beyond technical execution and asks whether data supports the business process it is meant to serve.
This is especially important for analytics, AI, risk, customer, finance, healthcare, and real-time systems.
Monitoring Data Quality Rules
Data quality rules should reflect business requirements. Required fields, valid values, duplicate limits, accepted ranges, referential integrity, reconciliation totals, and anomaly thresholds should be defined by domain.
For example, a customer dataset may require a canonical customer ID and valid account status. A product dataset may require SKU, category, publication status, and approved attributes. A finance dataset may require account, cost center, currency, and period alignment.
Reliability monitoring should check these rules continuously, not only during initial pipeline development.
Routing Reliability Failures
A reliability failure should trigger a response path. Some failures can be retried automatically. Others require data engineering review, source system investigation, business owner approval, or governance escalation.
def route_data_reliability_issue(issue):

    if issue["type"] == "source_missing":

        return {"owner": "source_system_owner", "action": "restore_source_feed"}


    if issue["type"] == "schema_changed":

        return {"owner": "data_engineering", "action": "review_pipeline_contract"}


    if issue["type"] == "quality_failed":

        return {"owner": "data_domain_owner", "action": "review_business_rule"}


    if issue["type"] == "downstream_stale":

        return {"owner": "analytics_operations", "action": "review_refresh_dependency"}


    return {"owner": "data_operations", "action": "manual_review"}
This keeps the logic operational. Observability is useful only when issues are classified and routed to the team that can resolve them.
Preventing Silent Failure in AI and Analytics Workloads
AI and analytics workloads are sensitive to silent reliability issues. A missing feature, delayed source, changed category definition, or stale training input may not break a pipeline immediately, but it can degrade model output or reporting trust.
Data reliability monitoring should therefore include downstream impact checks. Feature freshness, input completeness, metric consistency, and source distribution changes should be monitored where AI or critical analytics depend on the data.
At scale, this prevents engineering teams from treating pipeline success as proof that analytical output is safe.
Technology and Architecture Considerations
Data Observability Engineering requires tooling, but it should not be reduced to a tool purchase. The architecture should connect orchestration, validation, lineage, metadata, logs, metrics, alerts, and incident workflows.
Tools such as Airflow, Dagster, Prefect, dbt tests, Great Expectations, Spark, Kafka, Snowflake, BigQuery, Databricks, Prometheus, catalogs, and data observability platforms can support this model. In today’s competitive landscape, organizations are increasingly focused on data pipelines for enterprise scalability. These pipelines enable businesses to handle large volumes of data efficiently and respond to market demands swiftly. By leveraging advanced tools and architectures, companies can ensure their data infrastructure supports growth and transformation.
Integrating Observability With Pipeline Execution
Observability should be integrated into pipeline execution. Validation results should influence pipeline status. Freshness checks should affect downstream publication. Schema changes should trigger review. Lineage should update when transformations change.
If observability runs separately from pipeline operations, alerts may arrive too late or lack enough context for action.
In practice, observability should become part of the pipeline lifecycle: build, test, run, monitor, alert, remediate, and review.
Connecting Metadata, Lineage, and Monitoring
Metadata explains what a dataset is. Lineage explains where it came from and where it goes. Monitoring explains whether it is healthy. These layers should be connected.
When a table fails validation, teams should know its owner, upstream sources, downstream reports, data domain, last successful run, and affected consumers. Without that context, observability signals create investigation work instead of reducing it.
The OECD’s data governance work describes data governance as technical, policy, and regulatory frameworks for managing data across its value cycle. Observability engineering supports that model by making data behavior visible across creation, transformation, use, and remediation.
Designing Alerts That Reduce Noise
Alert design is a core engineering task. Too many alerts create fatigue. Too few alerts allow silent failures. Alerts should be tied to severity, ownership, and business impact.
A failed low-risk enrichment job may create a ticket. A stale finance dataset during close may require immediate escalation. A schema change affecting an AI feature pipeline may require both data engineering and model owner review.
Good alerting is not just detection. It is prioritization.
Governance and Auditability in Data Observability Engineering
Governance defines what must be monitored, who owns reliability, how exceptions are approved, and how incidents are reviewed. Auditability preserves the evidence behind pipeline behavior and remediation decisions.
NIST’s Security and Privacy Controls for Information Systems and Organizations includes control families for audit and accountability, assessment and monitoring, configuration management, incident response, and system and information integrity. Enterprise observability engineering can apply the same control mindset by preserving evidence of pipeline runs, validation outcomes, reliability incidents, and remediation actions.
Creating Observability Ownership
Each production pipeline or data product should have an observability owner. Ownership may include data engineering, platform engineering, data operations, domain owners, governance teams, and downstream consumer owners.
The owner should be responsible for thresholds, alert routing, monitoring coverage, incident review, and reliability improvement.
This prevents monitoring from becoming disconnected from accountability.
Maintaining Incident and Reliability Records
Observability systems should preserve records of incidents, alerts, validation failures, schema changes, freshness violations, remediation actions, and approved exceptions.
These records support root-cause analysis. They also help teams identify recurring failures, weak pipeline design, source instability, or missing governance controls.
Audit trails matter when data supports finance, healthcare, compliance, AI, customer operations, executive reporting, or operational decision systems.
Reviewing Reliability Trends
Reliability review should happen periodically. Teams should examine repeated freshness failures, high-noise alerts, unresolved ownership gaps, recurring schema changes, poor test coverage, and downstream consumer complaints.
The goal is continuous improvement. Observability is not only about detecting current failures. It should improve pipeline architecture and operating standards over time.
Operational Resilience Through Observability
Data Observability Engineering strengthens resilience by shortening detection time, improving diagnosis, and making recovery paths clearer. It gives teams the evidence needed to decide whether to rerun, quarantine, delay publication, notify consumers, or escalate.
This matters most when pipelines support high-impact business processes. Data engineering for telemetry systems plays a vital role in enhancing the quality and speed of data processing. By leveraging advanced algorithms and data storage solutions, teams can analyze telemetry data in real time. This capability enables organizations to make informed decisions that drive efficiency and innovation in their operations.
Reducing Time to Detection and Recovery
Fast detection reduces downstream impact. If teams discover a source failure before dashboard refresh, they can block publication or alert users. If they detect a schema change before transformation runs, they can prevent corrupted output. Also, if they identify stale AI features before scoring, they can delay or fall back.
Recovery also becomes faster when observability includes context: owner, dependency, failure type, severity, and affected consumers.
Protecting Downstream Trust
Downstream users lose trust when data issues are discovered repeatedly by business teams instead of data teams. Observability helps reverse that pattern by making reliability problems visible before they become user-facing.
Trust depends on consistent evidence. Teams should be able to show whether data is fresh, validated, complete, and fit for use.
Supporting Scalable Data Engineering Standards
Observability standards should be part of the engineering model. New pipelines should not go to production without freshness checks, validation rules, ownership metadata, lineage, and alert routing.
At scale, this creates consistency across pipeline teams and domains. It prevents observability from being added only after incidents.
Conclusion: Turning Observability Into Data Reliability Infrastructure
Data Observability Engineering helps enterprises operate data platforms with visibility, control, and accountability. It connects data observability framework design, pipeline health monitoring, data reliability monitoring, metadata, lineage, alerting, incident response, and governance review.
Strong observability prevents silent data failures from spreading into dashboards, AI models, finance reports, customer systems, healthcare analytics, IoT platforms, and real-time decision workflows. It shows not only whether pipelines ran, but whether the data they produced can be trusted.
The capability matters because enterprise data operations now support critical decisions and automated systems. When observability is weak, reliability problems appear late and recovery becomes reactive. When observability is engineered into the platform, data teams can detect issues earlier, route failures correctly, and preserve audit-ready evidence.
A structured review can help evaluate whether current workflows have reliable Data Observability Engineering, a data observability framework, pipeline health monitoring, and data reliability monitoring. You can run an external data infrastructure audit with our team to review your current setup and understand what is required to build reliable, enterprise-scale data engineering infrastructure.