
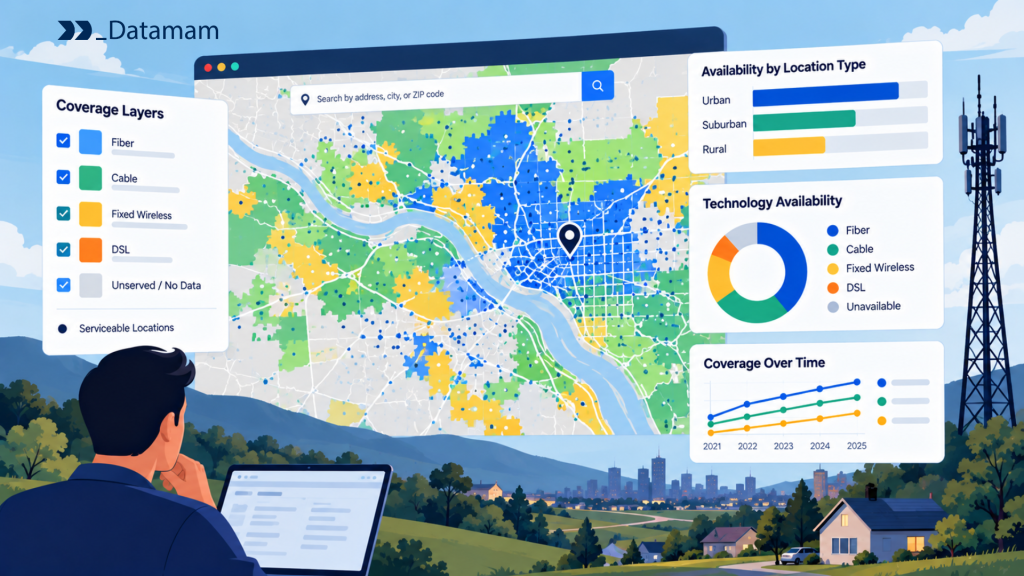
Broadband availability data describes where internet providers report that they can offer specified services under defined reporting rules. In the United States, the Federal Communications Commission (FCC) collects this information through the Broadband Data Collection (BDC) and publishes it on the National Broadband Map. The records are essential for evaluating the geography of competition, but they must not be confused with subscriptions, actual delivered speeds, or address-specific retail prices.
A reliable analysis starts by defining the unit of measurement. Fixed broadband data describes service at broadband-serviceable locations, while mobile broadband is represented through modeled coverage areas. Analysts must preserve that distinction, the reporting vintage, and the technology and speed definitions before joining records to other business information.
For the broad context, see [INTERNAL LINK -> Blog 01 | telecommunications market intelligence | suggested anchor: telecommunications market intelligence].
Key Takeaways
• The FCC National Broadband Map reports provider-submitted availability, not adoption, price, or consistently measured connection performance.
• Fixed broadband observations and mobile broadband polygons represent different geographic units and must be analyzed differently.
• Fixed data uses Broadband Serviceable Location Fabric records; the underlying full Fabric is licensed and should not be treated as an unrestricted public dataset.
• BDC submissions use June 30 and December 31 reference dates, while public releases, corrections, and challenges can arrive later.
• FCC downloads support provider-footprint analysis, but reported service must not automatically be interpreted as a live checkout offer at an address.
• Missing locations, absent availability records, and unresolved challenges are distinct data-quality states.
• Market opportunity screening requires complementary demand, pricing, infrastructure, and field-verification evidence.
What the FCC National Broadband Map Measures
The National Broadband Map is a US availability reference. It shows provider-reported fixed internet services at eligible locations and modeled mobile broadband coverage under the FCC’s defined parameters. It does not directly measure whether residents buy the service or what speeds they experience (https://help.bdc.fcc.gov/hc/en-us/articles/13532984820379-What-s-on-the-National-Broadband-Map).
Fixed broadband availability by serviceable location
For fixed broadband, the FCC organizes public availability around structures considered broadband-serviceable locations (BSLs). A provider reports a technology and maximum advertised download and upload speeds it offers at a location. This can help identify whether fiber, cable, fixed wireless, DSL, or other technologies are reported as available for that BSL.
Reported availability is not equivalent to a completed installation. The FCC’s standard-installation definition governs whether certain facilities-based providers may claim service at a location, but a specific resident’s experience may still depend on qualification and verification. Analysts should work with provider ID, technology, speed fields, location reference, and dataset vintage instead of reducing records to a binary ‘has internet’ flag (https://help.bdc.fcc.gov/hc/en-us/articles/5290946484763-Fixed-Broadband-Availability-Data-Overview).
Mobile network availability represented by coverage polygons
Mobile availability uses provider-submitted propagation models and geographic polygons rather than a list of fixed serviceable addresses. The models represent areas where a user should be able to establish specified mobile connections outdoors or in a moving vehicle under FCC modeling assumptions; they are not indoor coverage guarantees.
For competitor comparison, analysts should use the appropriate technology, provider, minimum-speed conditions, and reference date before overlaying polygons. A 5G-NR polygon does not establish that every device or plan will achieve identical performance throughout the area. Terrain, signal conditions, network load, and devices can all influence the actual experience (https://help.bdc.fcc.gov/hc/en-us/articles/10472720221211-What-to-Expect-after-Filing-a-Mobile-Challenge).
How FCC Broadband Availability Data Is Collected
The BDC combines standardized reporting by facilities-based providers with FCC verification and public or government challenges. Understanding that collection process makes it easier to identify appropriate uses, expected delays, and sources of disagreement.
Provider-submitted availability records
Facilities-based broadband providers report where they offer qualifying mass-market service and submit attributes required for their access technology. Fixed records refer to serviceable locations, whereas mobile records use modeled geographic coverage. The FCC reviews and publishes these submissions subject to ongoing corrections and challenges.
The records are official submissions, not independent confirmation of every advertised claim. A map can improve through revisions without an actual network build occurring. Preserve source-specific identity and the underlying reporting period so that changes between releases can be separated into verified footprint expansion, newly corrected reporting, and unresolved uncertainty. The FCC’s BDC FAQ explains the underlying submission and downloadable data formats (https://help.bdc.fcc.gov/hc/en-us/articles/7682769466395-Broadband-Data-Collection-BDC-FAQs).
The role of the Broadband Serviceable Location Fabric
The Broadband Serviceable Location Fabric is the FCC’s reference dataset of structures where fixed broadband could be installed. It provides location identifiers and geographic records for comparison with provider filings. The Fabric is developed from a mix of addresses, property records, imagery, and other inputs; it should not be mistaken for an independently verified list of actual subscriptions.
The full Fabric is distributed under licensing arrangements, including usage conditions that depend on the license. Public broadband availability downloads do not automatically grant the right to redistribute the full underlying Fabric records. A company joining its own address data to Fabric identifiers should check permitted use and preserve the Fabric version used (https://help.bdc.fcc.gov/hc/en-us/articles/5375384069659-What-is-the-Location-Fabric).
Reporting periods and dataset versions
BDC filings use June 30 and December 31 availability reference dates, with submissions typically due afterward. Public publication dates, map refreshes, challenge resolutions, and Fabric versions may not coincide with the original reporting date. An analysis must therefore store all relevant dates rather than labeling the most recent download as a real-time network snapshot.
For historical comparison, identify the ‘as of’ date, data download date, and applicable revisions. If a provider adds serviceable locations after a Fabric update, compare equivalent location universes when calculating growth. Otherwise, an increase in mapped locations may reflect a revised denominator instead of new construction (https://help.bdc.fcc.gov/hc/en-us/articles/13532984820379-What-s-on-the-National-Broadband-Map).
How to Access and Interpret FCC Broadband Data
FCC broadband availability can be explored through the interactive National Broadband Map or downloaded for independent analysis. The correct extraction method depends on whether the research concerns fixed locations, mobile polygons, provider comparisons, or challenge records.
Downloading fixed availability records
The FCC’s data-download interface provides public fixed availability datasets in CSV format. Files may be available by geography and provider and can be large enough to require a database or columnar analytical tool rather than an ordinary spreadsheet. Before analysis, inspect the data dictionary and confirm the vintage and filter selections (https://help.bdc.fcc.gov/hc/en-us/articles/10467446103579-How-to-Use-the-FCC-s-National-Broadband-Map).
A typical workflow imports the files into typed columns; validates provider IDs, technology codes, speed units, and location references; and retains both source fields and normalized representations. Do not invent a geographic match when the corresponding location is absent or ambiguous. For large-scale joins, see [INTERNAL LINK -> Blog 19 | broadband data integration | anchor: broadband data integration].
Working with mobile GIS coverage files
Mobile broadband coverage data can be downloaded in GIS-compatible forms, including formats such as Shapefile and GeoPackage. The FCC’s step-by-step download guidance describes selection of provider, availability date, technology, and alternative spatial representations. Analysts must avoid mixing hexagonal summaries with raw modeled-coverage polygons without understanding the resolution and representation (https://help.bdc.fcc.gov/hc/en-us/articles/43909220634651-How-to-Download-Mobile-Broadband-Coverage-Data-from-the-FCC-s-National-Broadband-Map-Step-by-Step-Instructions).
For comparable provider overlays, use a common coordinate reference system, valid geometries, and matching technology and speed criteria. Report geographic area, population exposure, or other denominators only when the corresponding reference data and assumptions are specified. An area share is not equivalent to a subscriber share.
Understanding provider, technology, and speed fields
A broadband availability record has several dimensions. Provider and brand identification determines whom the data attributes service to; technology describes the access medium; and speed fields describe advertised or modeled thresholds under the filing rules. Residential versus business service and low-latency attributes may matter for certain analyses.
Do not merge all fiber and fixed wireless observations under a generic ‘broadband’ label without preserving the technology. Similarly, do not use the maximum advertised download field as a measured average connection speed. The FCC’s description of its review-map attributes illustrates that field meanings differ between fixed and mobile submissions (https://help.bdc.fcc.gov/hc/en-us/articles/8161159923483-How-to-use-the-Review-Map-Function-for-Availability-Data).
| Record dimension | Fixed broadband example | Mobile broadband example |
| Geographic unit | Broadband-serviceable location | Modeled coverage polygon |
| Service attributes | Technology, maximum advertised speeds | Technology, minimum modeled speed thresholds |
| Common business question | Which providers report service here? | Which operator reports outdoor reach in this area? |
| Not established | Subscriber count, quoted retail price | Indoor quality, measured typical speed |
What Broadband Availability Records Cannot Prove
The limits of availability information matter as much as its coverage. Incorrectly interpreting the data can create false estimates of competitive share, coverage quality, market demand, and potential returns on deployment.
Availability versus active subscriptions
Availability indicates where a service can be purchased under the reporting definition. Adoption indicates who actually subscribes. The FCC explicitly distinguishes these concepts on the National Broadband Map (https://help.bdc.fcc.gov/hc/en-us/articles/10476040597787-How-to-Submit-an-Availability-Challenge).
An address reporting three competing broadband providers is not evidence that each has an equal share of customers. Similarly, an operator’s reported coverage footprint does not establish subscriber penetration. To estimate active subscriptions or revenue share, combine consistent regulatory or operator-reported subscription metrics with a clearly defined geographic denominator; see [INTERNAL LINK -> Blog 17 | telecom market share analysis | anchor: telecom market share analysis].
Advertised speeds versus measured performance
Fixed availability files include advertised service capabilities, not the actual speeds every subscriber receives in practice. Mobile coverage is modeled according to the applicable filing parameters. Neither should be substituted for observed throughput, latency, packet loss, or reliability measurements.
A performance comparison requires controlled field tests, representative crowdsourced measurements, or other appropriately validated network observations, with sampling limitations clearly stated. One poorly performing household Wi-Fi test should not be treated as proof that the underlying access network cannot deliver the advertised tier. See [INTERNAL LINK -> Blog 12 | telecom network benchmarking | anchor: telecom network benchmarking].
Why location-level availability does not confirm a retail offer
A regulatory statement that a provider offers qualifying service to a location does not provide the full retail plan, price, installation appointment, discount eligibility, or equipment fee that a customer would receive. Plan catalogs may vary by account status, neighborhood, bundle, or current campaign.
For commercial price intelligence, analysts need separate address-level retail observations with sources and collection dates. They should compare regulatory availability and website quotation as corroborating but non-identical evidence. A missing price quote is not by itself proof that the FCC record is inaccurate; it may reflect a website error, an unavailable tier, or insufficient address qualification. See [INTERNAL LINK -> Blog 05 | broadband price monitoring | anchor: broadband price monitoring].
Identifying Gaps and Errors in Broadband Maps
Availability records are continually tested and revised. Analysts should treat map disagreements as opportunities for investigation, not immediately declare the provider wrong or the location unserved.
Missing or inaccurate serviceable locations
A broadband-serviceable structure can be missing, misplaced, or associated with an incorrect address or unit count. The FCC accepts location challenges to correct some of these problems, and its guidance warns that address and building records do not always correspond one-to-one (https://help.bdc.fcc.gov/hc/en-us/articles/10475216120475-How-to-Submit-a-Location-Challenge).
For market analysis, compare candidate addresses to the appropriate Fabric universe and maintain ‘unmatched’ and ‘suspected missing’ categories. Do not simply count every unmatched business address as lacking broadband. Geographic matching should use explicit tolerances and review procedures, particularly for multi-unit structures.
Understanding availability challenges and corrections
The FCC allows availability and location challenges through defined processes. An availability challenge disputes an operator’s reported service capability, while a location challenge addresses a feature of the underlying location reference. The two require different evidence and produce different correction paths (https://help.bdc.fcc.gov/hc/en-us/articles/10476040597787-How-to-Submit-an-Availability-Challenge).
A filed challenge is not the same as a sustained finding. Track whether a challenge is pending, conceded, resolved, rejected, or reflected in the published dataset. When comparing years, analysts should document changes caused by challenge resolution separately from likely network builds. This distinction prevents a correction event from being reported as a competitor’s market-entry event.
Using Broadband Availability Data for Market Intelligence
The most useful market applications translate provider-reported availability into qualified questions for commercial teams. They identify likely areas of competitive intensity and potential need, then combine those signals with independent evidence before large investments.
Mapping competitor footprints
At fixed locations, count distinct facilities-based providers by technology and geographic area, taking care not to double-count multiple plans from the same operator. For mobile markets, overlay comparable modeled coverage areas, then disclose the relevant speed and technology definitions. These outputs can identify overlap and possible new competition.
Provider-reported presence does not show actual customer switching, revenue, or internal network capacity. Include the coverage vintage and validation status in every map. Where an operator has published a newer launch announcement, treat that signal separately until confirmed by a comparable dataset.
Measuring technology competition
Measure fiber, cable, DSL, satellite, and fixed wireless availability separately before creating broader market categories. A location with two technologies may have meaningful customer choice, but the economics and service characteristics may differ. A map showing three brands does not prove three independent physical networks where wholesale access or shared infrastructure exists.
A useful competition scorecard identifies the share of eligible locations by technology and the number of distinct reporting providers under each definition. Report how the answer changes when minimum speed filters or technology inclusion rules change; sensitivity analysis is essential when a business decision relies on ‘underserved’ classifications.
Identifying potential underserved markets
Potential underserved markets can be screened by combining FCC availability records with housing density, business activity, demographics, local prices, and the presence of existing or planned infrastructure. The first output should be a candidate list with uncertainty flags, not an assertion that every apparently underserved address is economically attractive. For example, a small market with low competitive availability may still face high construction costs or limited willingness to pay. Conversely, an area with existing competition may offer a viable differentiated business service. Field validation, commercial quote checks, and engineering assessment remain necessary before investment (https://help.bdc.fcc.gov/hc/en-us/articles/10467446103579-How-to-Use-the-FCC-s-National-Broadband-Map). The deeper decision framework belongs in [INTERNAL LINK -> Blog 13 | broadband expansion planning | anchor: broadband expansion planning].