
Key Takeaways
- Mobile radio coverage, fixed wireless address eligibility, and active FWA subscriptions are different measures.
- Spectrum, sector capacity, terrain, premises equipment, and backhaul constrain viable service areas.
- Compare FWA, fiber, and cable using effective price, installation, speed consistency, and usage conditions.
- National carriers and regional WISPs may have very different products and network economics.
- Monitor new addresses, price terms, measured performance, and deployment announcements separately.
- Forecasts require consistent revenue categories and clear definitions of subscribers, connections, and passings.
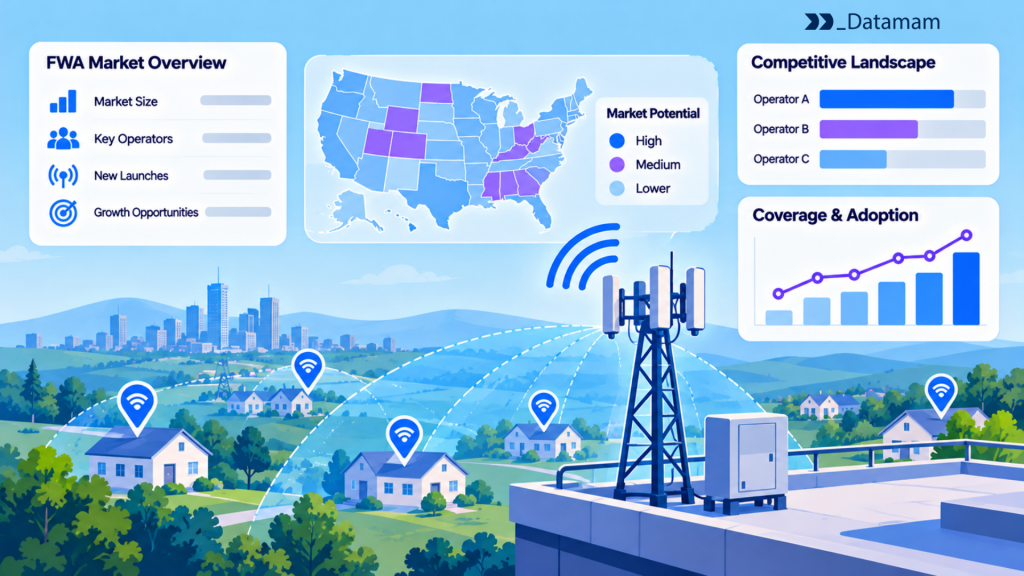
Fixed wireless access (FWA) delivers broadband to a fixed customer location using radio connections rather than a wired last-mile drop. It has become a meaningful competitive alternative in some US markets, but the commercial opportunity varies sharply with spectrum, site capacity, geography, available wired networks, and the specific address eligible for service. A mobile coverage map alone cannot establish that every household can order fixed wireless.
A credible fixed wireless access market analysis therefore compares actual customer propositions and network constraints, not just 5G headlines or market-size forecasts. It evaluates what providers offer at representative addresses, how performance varies under load, and where a radio-based service may compete profitably with cable or fiber. This article sets out an evidence-based framework for that comparison.
How Fixed Wireless Access Is Changing Broadband Competition
FWA can extend retail broadband competition into locations where another wired construction project would be costly or slow. Its value proposition often involves easier installation or competitive prices, but capacity and indoor reception still matter. Operators should track which addresses actually qualify and the specific plan available there, rather than count every 5G tower as a household broadband opportunity.
4G and 5G fixed wireless versus traditional wired broadband
FWA uses LTE, 5G, or other radio systems to connect customer premises equipment to a serving network. Fiber and cable deliver a wired last-mile access path, usually with different capacity and variability profiles. A 5G label describes the radio generation, not a guaranteed throughput or latency at every eligible home. In dense areas, a well-engineered fixed wireless offering may provide useful speeds and rapid setup, while a fiber product may deliver more consistent high upload capacity. A comparison should account for measured evening performance, product-level speed descriptions, data policies, and installation requirements instead of relying on technology marketing alone.
National carriers and regional fixed wireless operators
National mobile carriers may offer FWA using licensed spectrum and capacity shared or managed alongside mobile traffic. Regional wireless internet service providers can operate localized networks with different spectrum, customer equipment, service areas, and support models. The two segments should not be combined into one ‘5G home internet’ category without examining underlying technology and service terms. For a competitive study, identify facilities-based operator, retail brand, coverage method, eligibility process, and whether each offer targets residential or business customers. National scale does not establish a stronger address-level offer, just as local ownership does not guarantee superior service quality.
Which Market Variables Determine FWA Opportunity?
FWA opportunity is the intersection of demand, radio feasibility, commercial competitiveness, and available capacity. Unlike a basic geographic footprint, the addressable market can change with sector loading, customer equipment, and installation constraints. A market model should treat eligibility as a measured or explicitly modeled outcome rather than a permanent property of an entire ZIP code.
Spectrum and network capacity
The usable spectrum portfolio, channel width, interference conditions, radio equipment, site loading, and backhaul shape how many fixed wireless subscribers can be served while maintaining acceptable experience. Lower-frequency spectrum can provide useful reach but often with different capacity tradeoffs than higher bands. A cell with strong outdoor signal may still be unsuitable for additional FWA accounts if spare capacity is limited. Market models should estimate available sector capacity and peak-hour load where credible data exist, then run conservative take-rate scenarios. A public license record demonstrates authorization, not the amount of unused broadband capacity at a particular tower.
Geographic coverage and address eligibility
A modeled mobile footprint identifies places where a mobile connection may be available under specified assumptions. The FCC National Broadband Map distinguishes mobile modeled coverage from location-level fixed broadband availability. FWA providers may check individual addresses for sector capacity, building exposure, equipment compatibility, or service-plan restrictions. Collect address-level outcomes where access is permitted, preserving the location scenario, timestamp, and specific offer. Treat timeouts and inconclusive eligibility results as unknown rather than unavailable. A broad coverage map must not be converted directly into a count of homes that can order the product.
Customer demand and alternative broadband options
Competitive demand depends on what residents and businesses already buy, what alternatives they can obtain, and whether price, installation, or performance creates a reason to switch. Segment homes with cable-only access, fiber competition, limited terrestrial service, and business-specific connectivity needs. Census internet-subscription data provide household context but do not show which operator a household would choose. Compare offers using standardized introductory and post-promotion costs. Avoid assuming every unserved or expensive location will adopt FWA; equipment placement, support expectations, and local willingness to pay can reduce practical demand.
Comparing FWA Against Fiber and Cable
A customer-oriented comparison should start with a defined address and use case, then measure whether each technology offers an eligible product with sufficient service quality. A network-owner comparison must additionally account for build economics, operating cost, capacity, and the impact of adding customers on existing traffic.
Price and installation considerations
FWA can reduce the need for new street-level civil construction, but installation may still require customer equipment, outdoor antennas, site visits, or signal assessment. Fiber may have substantial initial network costs but low incremental cost per additional connection in an already-served building. Cable may offer a familiar install path but vary in equipment fees and promotional pricing. Record actual plan eligibility, recurring charges, device rental or purchase, installation fees, contract terms, and after-promotion prices. A low monthly headline should not win the comparison if mandatory equipment or an early termination condition makes the relevant customer scenario more expensive.
Performance, reliability, and capacity tradeoffs
Radio performance can change with distance, building attenuation, weather in some bands, interference, and shared cell utilization. Wired performance depends on local network architecture, provisioning, home equipment, and contention. Measure comparable customer experiences, including download and upload throughput, latency, evening variability, outages, and installation success. Independent measurement sources such as the Ookla open performance maps can provide regional context, but a sampled tile is not a verified FWA plan outcome. Their noncommercial license also matters to enterprise reuse. For material investment or service claims, controlled tests at representative addresses are preferable to technology-wide assumptions.
Where each technology has a competitive advantage
Fiber can be particularly attractive where high service consistency, symmetrical bandwidth, and long asset life justify construction. Cable may remain highly competitive where existing plant and product upgrades provide strong value. FWA can be practical where radio coverage and spare capacity exist and new wired construction would be expensive. These are conditional advantages, not universal winners. Compare representative urban, suburban, and rural scenarios, and include differences in business-service requirements. A fixed wireless plan capable of satisfying a typical household may be unsuitable for an enterprise location needing contractual service levels or a particularly demanding upload workload.
How to Monitor FWA Market Expansion
Market monitoring should distinguish official reported availability, operator marketing, address-level retail responses, and confirmed subscriptions. Each evidence stream has different refresh intervals and limitations. A competitor may announce a rollout well before many premises become eligible, or silently change its address checker without a prominent press release.
New service launches and footprint changes
Track launches by operator, announced market, relevant technology, planned date, and current availability evidence. Use the FCC’s Broadband Data Collection updates to compare reported footprints across vintages, but remember that filings are periodic rather than real-time commercial launch logs. Where allowed, maintain a stable panel of representative customer addresses and record eligibility changes. A new eligible address is stronger evidence of retail reach than a broad market announcement, but still does not prove a successful installation or a paying subscriber.
Retail pricing and promotional positioning
Track recurring FWA rates alongside any required mobile-line bundles, autopay terms, introductory months, hardware charges, and usage restrictions. Competition may be localized, with address-specific eligibility and discounts. Compare 12- and 24-month total cost for consistent customer profiles rather than placing an introductory FWA price against a standard fiber tariff. A campaign that adds a free gateway may change the proposition without reducing the published service rate. Preserve each source version and offer effective date so that analysts can distinguish a genuine pricing change from a banner refresh.
Measured network performance
Performance evidence should describe the customer setting, access technology, network conditions, and sample coverage. FWA performance can differ from ordinary mobile results on the same broader operator because customer premises equipment, antennas, and scheduling policies differ. A regional speed-test map may mix phones and home-internet connections, requiring additional identification before making an FWA-specific claim. Track evening throughput, latency distribution, and connection reliability across representative eligible addresses. Report limited sample coverage openly, especially in sparsely populated regions where a handful of unusually strong or poor tests can dominate a published average.
Identifying Geographic Opportunities for FWA
Opportunity screening combines available radio infrastructure and capacity with a realistic address-level demand profile. Prioritize regions where the required service can be delivered well, not merely areas where published mobile coverage polygons are large. A good shortlist includes verification tasks for sector loading, signal, premises installation, and competitor offers.
Markets without strong wired competition
Areas with limited cable or fiber options may present a product gap, but low competition alone does not make FWA attractive. Confirm qualifying fixed broadband availability, household concentration, viable sector exposure, and backhaul economics. Government deployment plans may introduce future wired competition, so read project status before assuming a durable gap. Evaluate price sensitivity and customer equipment requirements for rural or low-density areas. A cluster of addresses with a credible radio path and usable backhaul can be more attractive than an entire county that appears weakly served on an aggregate map.
Suburban, rural, and capacity-constrained urban areas
Suburban areas can combine housing density and near-network radio sites, but sector utilization may limit incremental subscriber capacity. Rural areas may have fewer wired alternatives but require longer reach and careful customer-premises design. Dense urban areas can offer demand but face more challenging interference, obstructed indoor reception, and competitive fiber or cable. Model each setting independently, with capacity and installation feasibility as explicit constraints. Do not project a nationwide customer mix onto a local sector without testing what the radio network can support during busy periods.
Why Published FWA Market Forecasts Can Disagree
Forecasts vary because research products measure different parts of the market and apply different definitions. Before comparing growth percentages, identify the geographic scope, product types included, base year, currency, and whether the measure refers to subscribers, hardware, infrastructure spending, or services.
Hardware revenue versus service revenue
A report about FWA equipment may count customer gateways, radio access infrastructure, and professional installation, while a retail broadband forecast may track recurring subscriptions or consumer spending. Equipment shipments can grow without an equal change in active broadband revenue, particularly when upgrades replace existing units. Conversely, a service base may grow without substantial new hardware sales in a period. Never combine supplier hardware revenue with retail service revenue and call the sum an independently verified FWA market size. Document exclusions and overlaps before repeating third-party forecasts.
Subscribers, connections, coverage, and addressable households
An active connection is not the same as a reported eligible household or an entire covered population. Some business sites maintain multiple connections, while operators may use different criteria for activated versus billable accounts. Coverage polygons, serviceable locations, current subscriptions, and potential addresses belong in separate columns. When comparing external forecasts, reconcile whether they include cellular home internet, specialized regional wireless, business access, or only certain 5G products. If no reconciliation is possible, present the forecasts as different estimates of different populations rather than competing measurements of a single fact.
What External Data Reveals About FWA Competitive Positioning
A useful FWA intelligence program joins four layers: technology and radio context, reported or checked address eligibility, local price and promotion terms, and independently observed performance. It can identify where a provider is expanding retail reach, where FWA is positioned against cable or fiber, and which markets deserve closer investigation. It cannot reveal the operator’s proprietary spare capacity or prove a strategy from public offers alone.
For commercial action, deliver a shortlist of addresses or markets with source dates, competing products, confidence levels, and the next verification step. An operator can then test whether its pricing or network investment assumptions still hold. The strongest FWA analysis respects what public data cannot measure while using repeated observations to identify real competitive change.