
Key Takeaways
- Define overbuild as competing physical access networks, not just multiple retail brands at one address.
- Match providers on the same broadband-serviceable locations and reporting vintage.
- Compare fiber-over-fiber, fiber-over-cable, and other access-technology overlap separately.
- Use provider-reported availability as screening evidence, not confirmation of active paid service.
- Test revenue, take rate, and acquisition assumptions under plausible competitor responses.
- Label missing and uncertain source records instead of overstating overbuild risk or opportunity.
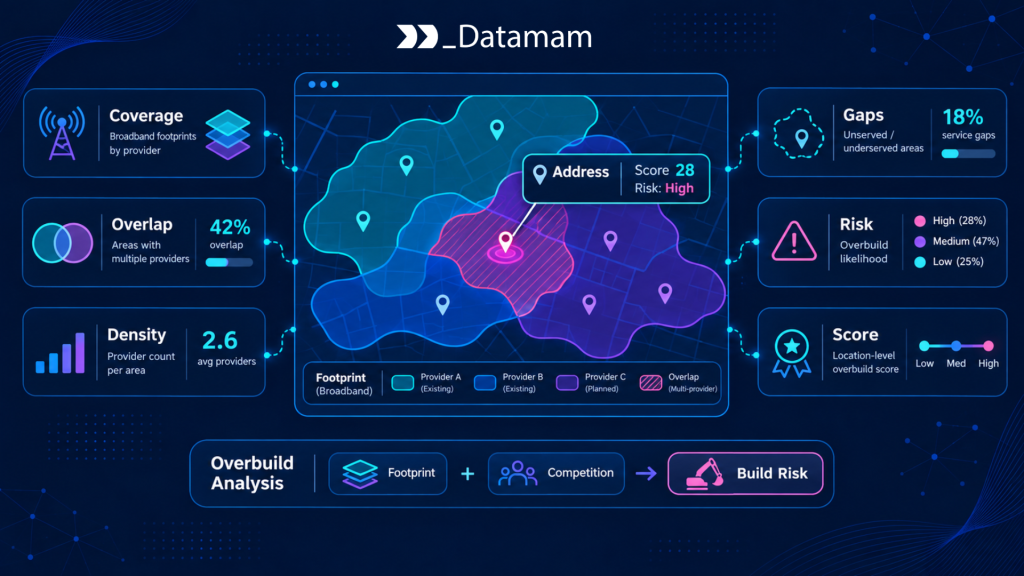
Broadband overbuild analysis studies where multiple networks can serve the same premises and what that overlap means for competition and investment. It is not simply a map of competing logos. Retail brands can share infrastructure; a reported fiber offer may not match an operational build; and two networks passing the same road do not necessarily compete for every building on it.
A useful overbuild assessment identifies the facilities-based alternatives at a common set of broadband-serviceable locations, compares relevant technologies, and examines the economics of winning subscribers where an incumbent already operates. The goal is to distinguish genuine network duplication from ordinary retail choice and to understand how much uncertainty remains before committing construction capital.
What Is Broadband Overbuild?
Overbuild occurs when additional network infrastructure is deployed to serve locations already reached by another infrastructure network. The term is most useful when it refers to a defined service class and physical access technology. A meaningful analysis specifies whether the proposed build is new fiber alongside existing fiber, fiber competing with cable, or fixed wireless overlaying established wired service.
Network duplication versus ordinary retail competition
A market may contain several consumer-facing providers without several independently owned last-mile networks. Reseller and wholesale arrangements can create retail choice over shared facilities. Network duplication means that distinct access infrastructures can physically deliver comparable service to the same location. For infrastructure planning, count facilities-based owners or independently controlled access networks, while retaining separate brand fields for commercial analysis. A three-brand result should not automatically be labeled three-way physical overbuild. Confirm ownership relationships from filings, provider information, or documented wholesale arrangements when their distinction materially affects the investment case.
Fiber-over-fiber versus fiber-over-cable competition
Fiber-over-fiber is a more direct infrastructure overlap than fiber entering a cable-heavy area, but both can create genuine competition for customer spending. Fiber and cable may differ in upload capability, reliability, installation economics, and pricing, while overlapping fiber networks may compete largely on availability, speed tiers, brand, and customer experience. Keep technology-specific overlap measures rather than reducing every contest to a binary overbuilt/not overbuilt designation. For example, a serviceable location with one fiber and one cable provider is not the same analytical category as one with two independent fiber owners and cable. Both belong in a market risk model, but in different cohorts.
Why Overbuild Risk Has Become a Strategic Question
Large infrastructure investments require realistic assumptions about the share of a local market a new provider can capture. When incumbents or new entrants contest the same addresses, prices and acquisition costs may change before construction is completed. Overbuild analysis helps reveal where the business case depends on persuading users to switch rather than connecting previously unserved customers.
Network investment and competing serviceable locations
Infrastructure cost is incurred at route, passing, and installation levels, while realized revenue comes from activated subscriptions. For a proposed build of 5,000 passings, an investor needs to know how many addresses can actually be served, how many already have comparable alternatives, and how that competition influences take rate. The FCC’s National Broadband Map data provide a provider-reported location-level starting point. Analysts should pair that with current retail offers and engineering feasibility. Presence on a map does not demonstrate a rival’s capacity, retention strength, or pricing response.
What observed overbuild can and cannot tell us about profitability
High overlap can indicate competition but does not prove poor economics. A new entrant may win share through a better product or lower operating cost, whereas a lightly contested market may be expensive to build or difficult to sell into. Overbuild data alone cannot establish customer acquisition cost, churn, contribution margin, or capital payback. An investor should therefore model competing outcomes. A town with two existing networks could still be viable if the proposed build has low incremental route cost and credible differentiated demand. The proper conclusion from an overlap map is a hypothesis about competitive exposure, not a profitability forecast.
Data Required for Broadband Overbuild Analysis
The most useful record structure links the location universe, network identity, technology, data vintage, and source evidence. Additional commercial layers help explain whether potential service overlap creates material pricing pressure. Keep raw records and derived overbuild classifications separate so definitions can be changed without losing original evidence.
Provider-level availability by location
Start with a consistent broadband-serviceable-location reference and the provider availability rows associated with it. For each location, count distinct qualifying networks meeting a stated technology and speed threshold. FCC BDC submissions use semiannual reference dates, so a current retail launch may precede its appearance in the official dataset. The FCC’s BDC explanation clarifies that fixed availability is provider reported. Deduplicate multiple speed tiers from one provider before calculating competitive counts, and preserve rows that cannot be matched to the chosen location universe.
Infrastructure type, network ownership, and deployment dates
Technology and ownership determine whether two names represent independent facilities. Build an entity table for legal provider, consumer brand, parent company, physical network owner, and material wholesale relationships where documented. A construction announcement, granted permit, reported availability, and verified active installation are distinct milestones. Include evidence dates so that a market with planned competing fiber is not treated as already operationally overbuilt. Where independent network ownership cannot be verified, classify the relationship as unresolved. The result is a smaller but more credible estimate of genuine infrastructure duplication.
Market demand and local economic conditions
Demand and economics decide whether overlap matters to an investment. Relevant variables include households, small-business sites, income, building density, existing adoption, typical broadband pricing, projected network cost, and plausible subscription retention. Census computer and internet data provide context for subscriptions and demographics but not a subscriber list by provider. Use a common geography when joining data and avoid claiming that an unconnected household is necessarily waiting for a new competing network. Strong commercial evidence may require local pricing studies and interviews rather than relying on population maps alone.
Measuring Competitive Network Overlap
Define a study boundary, location universe, access technologies, and whether the analysis concerns currently reported infrastructure or planned projects. Then calculate provider overlap for each location, aggregate to decision areas, and document the share of observations excluded because of incomplete or inconsistent data.
Counting competing facilities-based providers
At each location, derive a count of distinct facilities-based networks rather than rows, plans, or brands. Make provider matching rules explicit, including merger histories and shared networks. Calculate separate measures for all qualifying terrestrial providers, fiber owners, and any other investment-relevant class. A location with five plan options from one operator remains one facilities-based alternative under that definition. Where the ownership evidence is incomplete, publish both a conservative count using confirmed networks and a broader count using reported providers. The difference is a useful measure of uncertainty, not an error to hide.
Estimating the share of locations exposed to overbuild
Overbuild exposure can be expressed as the percentage of eligible locations with at least two independently operated qualifying networks. For a specific proposed entrant, the more useful denominator is its planned passings, with numerator equal to passings already reached by one or more comparable rivals. A hypothetical build serving 2,000 locations, 1,300 of which have an incumbent cable or fiber network, has 65 percent existing-network exposure under that definition. This does not mean 65 percent of revenue is at risk, because customer choice and pricing response still depend on take rate and differentiation. State the numerator and denominator with every headline metric.
Tracking new competition between data vintages
Compare identical location universes at two reporting dates whenever possible. Flag locations newly appearing in the Fabric, changed provider IDs, corrected technology labels, and resolved challenges before attributing all differences to new builds. A new reported competitor may be a real market entry, a data correction, or a previously omitted facility. Use dated provider launch evidence, permits, and address-check responses to support major claims. The FCC provides separate location challenge guidance, which illustrates why the denominator and source records may change without any construction event.
How Overbuild Changes Broadband Economics
Overbuild changes the plausible customer acquisition path and the value of future subscriptions. It can also change incumbent behavior before the entrant begins service. Translate location exposure into scenarios for adoption, pricing, retention, marketing, and network investment instead of multiplying total passings by a fixed revenue assumption.
Take-rate uncertainty and customer acquisition
Where an incumbent serves most households, a newcomer must win switchers or stimulate additional demand. Acquisition may require marketing, installation credits, or longer promotional periods. A base case assuming 30 percent take rate should be tested against lower outcomes, such as 20 percent, rather than presented as guaranteed. The real break-even point depends on contribution margin, installation expense, debt costs, and capital allocation. Historical performance in comparable overbuilt areas is helpful if networks, customer profiles, and competitor conditions are similar. Do not convert an availability count into an adoption forecast without explaining this mechanism.
Pricing responses and revenue dilution
A competitor’s new offer may push incumbents toward discounted introductory rates, retention credits, faster tiers, or bundled products. A new network can gain subscribers while earning lower revenue per user than originally forecast. Monitor address-specific retail prices and offer terms in the proposed market; broad national averages may miss local targeting. Analyze a price-stress case together with take-rate stress, since the two can interact. If the business case remains robust only when no incumbent responds, the project may warrant a higher risk allowance or staged investment.
The distinction between potential and realized competition
Potential competition exists when two qualifying networks report access to an address. Realized competition involves customers seeing workable offers, switching, and producing observable commercial outcomes. A reported overbuild footprint may never translate into meaningful contestability if installation cannot be completed, pricing is unattractive, or one network serves only a restricted segment. Analysts should annotate observed retail eligibility, activation evidence, and time since launch. This allows a scorecard to distinguish newly exposed markets from mature overbuilt markets, which may have very different switching patterns and operating economics.
When Overbuild Analysis Produces Misleading Results
Risk estimates fail when unit definitions are inconsistent or source corrections masquerade as business events. Validation should be concentrated on markets that materially influence the build decision, rather than attempting to prove every row perfect at national scale.
Retail brands sharing underlying infrastructure
Counting brands as networks exaggerates physical competition. The issue arises in fixed wholesale broadband as well as wireless markets, where many brands can operate over a smaller set of facilities. Keep brand and infrastructure operator as separate entities and apply the count relevant to the investment thesis. If the question is consumer price choice, a brand-level comparison may be appropriate; if the question is expensive duplicated last-mile construction, it is not. Report unresolved ownership rather than guessing which operator controls a physical link.
Reported availability without operational verification
FCC availability filings are important standardized evidence, but they are neither address-specific contract quotations nor independently measured proof of activation. Some records may later be challenged or revised, while a marketing website may return a temporary eligibility error. Verify material contested locations using independent retail checks, construction evidence, or engineering inquiry under permitted procedures. Distinguish a confirmed negative quote from failed collection. An overbuild map that silently treats every reported footprint as fully operational can distort project timing and investment risk.
Building an Overbuild Risk Map for Investment Decisions
Construct a map that presents network exposure, not a simplistic red-or-green verdict. At each location or corridor, show qualifying competing facilities, technology overlap class, reporting date, planned-build status, uncertainty, and relevant cost or demand context. Aggregate to neighborhoods only after retaining the underlying location-level evidence. A useful project shortlist highlights high-cost corridors with strong incumbents, lower-cost adjacent expansions, and unresolved locations that need field validation.
The final investment review should combine network overlap with scenario cash flows and a list of verification dependencies. A model may identify where the proposed entrant competes against two existing fiber owners, but it cannot independently determine pricing behavior or future profitability. Treat overbuild intelligence as a disciplined input to engineering, commercial, and financial decisions, not a stand-alone return estimate.