
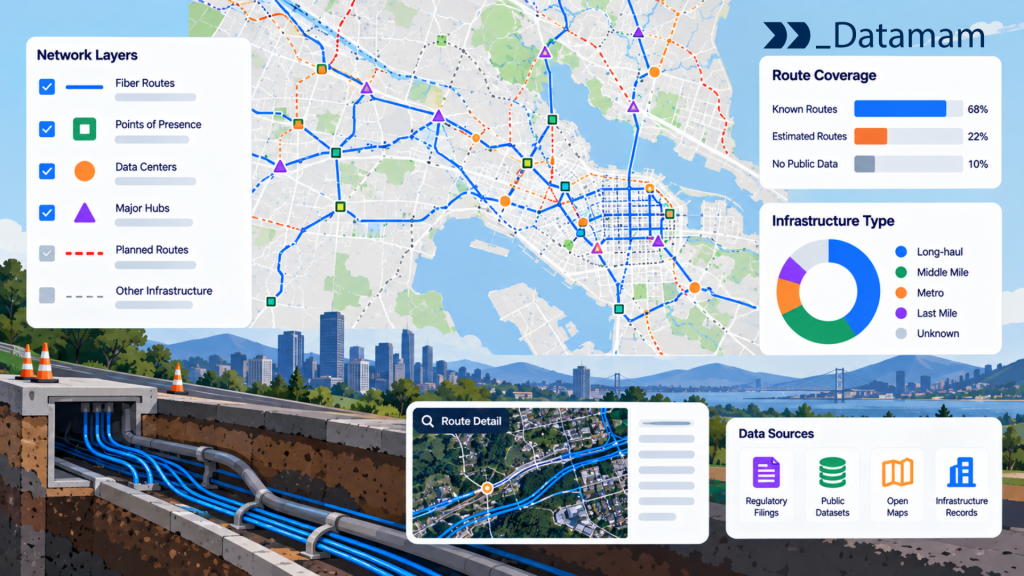
Fiber network mapping is the process of organizing geographic evidence about existing and proposed fiber infrastructure into a usable view of network routes, nodes, owners, and possible service relationships. It is difficult because fiber owners rarely publish a complete, current, surveyed map of every physical route and access point. Public availability maps, funding disclosures, permits, and commercial network datasets each describe only part of the picture.
A useful fiber map therefore begins by separating confirmed physical route segments from inferred corridors, service areas, and announced construction. For operators, investors, and public-sector planners, this distinction is essential: a line on a map is not automatically an operational fiber asset, a commercially accessible network, or proof that an address can obtain service.
Key Takeaways
• A physical fiber route and a broadband service-availability footprint describe different things and must not be mapped as equivalent.
• Backbone, middle-mile, and last-mile segments have different functions, ownership possibilities, and commercial implications.
• Public grant maps and announced projects can help identify candidate routes but do not prove construction or active service.
• Combine geometry, network nodes, owner attribution, provenance, date, and verification status in each route record.
• Geographic proximity to fiber does not establish spare capacity, interconnection rights, strand access, or retail availability.
• Use confidence-graded route overlays and sensitivity tests to avoid false conclusions about network overlap or geographic gaps.
• Investment screening should end with field, engineering, legal, and commercial validation before funds are committed.
What a Fiber Network Map Can Actually Represent
A fiber map may represent a buried or aerial cable route, a publicly reported corridor, the reach of a provider’s retail service, a funded project, or a modeled opportunity. These layers should never be merged into one unqualified ‘fiber coverage’ map. The value of the output depends on whether each geometry describes what it claims to represent.
Physical fiber routes versus service-availability areas
A physical route is a path of installed or planned fiber infrastructure. A service-availability area identifies locations where an operator reports offering internet service, which may depend on network topology, distribution facilities, equipment, and last-mile connections. The FCC National Broadband Map is primarily an availability map and does not provide a complete route-by-route inventory of buried or aerial fiber (https://help.bdc.fcc.gov/hc/en-us/articles/10467446103579-How-to-Use-the-FCC-s-National-Broadband-Map).
A serviceable location can be reachable through nearby infrastructure whose exact alignment is undisclosed; conversely, a long-haul cable can pass a building without offering service there. Maintain separate GIS layers for physical route evidence and address-level availability, and record the relationship only when a source supports it.
Backbone, middle-mile, and last-mile networks
Backbone fiber supports long-distance connectivity between major network locations. Middle-mile networks connect backbone capacity to regional or local networks, while last-mile access connects toward end-user premises. These categories are useful but can vary by network architecture and business context.
The National Telecommunications and Information Administration (NTIA) describes middle-mile infrastructure as broadband infrastructure that does not directly connect to an end-user location (https://broadbandusa.ntia.gov/funding-programs/enabling-middle-mile-broadband-infrastructure-program). A route’s role influences the meaning of nearby opportunities: a middle-mile corridor may reduce the cost of regional connectivity without creating a purchasable residential fiber plan along every segment.
Existing infrastructure versus proposed construction
Fiber project documents may describe concept routes, funded routes, construction-in-progress alignments, as-built records, or operational links. The map should expose this status rather than using the same line symbol for every stage. Proposed construction is particularly uncertain because routes can change during permitting, engineering, and right-of-way negotiation.
NTIA’s Middle Mile Program publishes award-recipient and planned-route information, but its disclosures warn that project details may change (https://broadbandusa.ntia.gov/funding-programs/enabling-middle-mile-broadband-infrastructure-program/award-recipients). A funding award alone does not establish completion. Preserve planned and verified operational dates independently and avoid crediting a market with new deployed infrastructure solely because it appears on an award map.
Where to Obtain Fiber Infrastructure Data
Fiber infrastructure data must be assembled from multiple sources selected for geographic coverage, acceptable usage rights, and evidence quality. A public-data starting point often identifies candidate networks but leaves route precision, ownership, or operating status unresolved.
Public infrastructure and funding maps
Federal and state broadband programs may publish project boundaries, funded corridors, progress information, and deployment obligations. NTIA’s Middle Mile award information can identify proposed or awarded routes in certain areas, while the Universal Service Administrative Company’s HUBB materials identify reported deployments at supported locations rather than a national fiber-cable route inventory (https://www.usac.org/high-cost/annual-requirements/submit-data-in-the-hubb/).
Funding datasets should be tagged with program, project stage, awardee, reporting period, and geometry type. Do not combine a state’s broadband availability polygon with a grant-funded middle-mile route as if both were physical cables. These sources are useful for market scanning, but lack of a public grant record is not evidence that no privately financed infrastructure exists.
Operator disclosures and permitting records
Operator network maps, investor materials, construction announcements, local excavation permits, right-of-way records, and utility attachment filings can provide route clues. Their accuracy varies: some are simplified commercial illustrations, while others are surveyed engineering drawings. A declared ‘fiber footprint’ may describe markets served without disclosing exact streets or underground alignments.
Record the type of disclosure, issuing entity, effective date, and geographic precision. Where the analyst needs a route-level answer, seek project plans, municipal utility records where lawfully available, or as-built documentation under appropriate permissions. Permit approval must not be treated as proof that a route was installed or activated.
Licensed route and network datasets
Specialized vendors and network owners may license route geometry, network nodes, ownership attributes, and historical updates. These sources can be useful when precise geographic coverage or commercial decision support exceeds what public records provide. Their suitability depends on source completeness, methodology, access rights, and whether the dataset differentiates surveyed route centerlines from estimates.
A procurement evaluation should request a representative geographic sample, field definitions, vintage information, accuracy methodology, and licensing conditions for internal analysis and derived maps. Confirm whether ‘owner’ means cable owner, network operator, conduit owner, wholesale provider, or an inferred association. Paying for a route dataset does not itself guarantee that every segment is current, physically accessible, or commercially leasable.
Building a Fiber Network Map From Multiple Sources
A reliable technical workflow separates raw evidence from standardized network entities and derived analytical layers. The objective is to preserve provenance while producing geometry that can be compared across regions, operators, and source dates.
GIS linework, network nodes, and route attributes
A physical-route representation typically uses line segments, while exchanges, huts, points of presence, splice locations, and possible interconnection sites can be represented as nodes when verified. Useful segment fields include source ID, operator or infrastructure owner where supported, route status, installation type, confidence, start and end node IDs, update date, and rights classification.
Do not infer connectivity simply because two polylines visually cross. One cable may run over another without a splice or accessible point of presence. Likewise, multiple line records may represent cables sharing one conduit. Store the network topology separately from simple geometric overlap, and reserve a confirmed connection flag for supported evidence.
Standardizing coordinates and route identifiers
Different sources may use geographic coordinates, projected coordinate systems, road centerlines, parcel references, or internal route IDs. Reproject data to a consistent coordinate reference system before measuring distance, and use suitable local projections for length and proximity calculations. Validate geometry for self-intersections, gaps, duplicates, and implausible jumps.
Keep raw and standardized geometries side by side. Route identity should not be generated solely from a rounded coordinate because curved alignments, parallel cables, and alternative road corridors can be extremely close. Use stable source IDs where available and assign your own versioned segment identifiers for analytical joins.
Reconciling conflicting route records
Conflicts arise when a public project map shows a planned corridor while a licensed dataset describes a nearby installed alignment. Different map scales, collection dates, or generalized geometry may explain the discrepancy. An analyst should not automatically average the two lines into a fictional route.
Rank source evidence by whether it is surveyed, as-built, permit-based, planned, or inferred; preserve conflicting geometries when uncertainty remains. Introduce a confidence status such as confirmed, supported, candidate, or unresolved. When the decision concerns a precise building or intersection, target verification to that location rather than attempting to resolve every mismatch across an entire national map.
| Evidence class | Example | Appropriate map label |
| As-built or surveyed record | Verified installed alignment | Confirmed route |
| Operator disclosure | Published network corridor | Reported route |
| Permit or grant application | Approved or proposed construction | Planned route |
| Inferred proximity | Road, address, or availability proxy | Candidate corridor |
The Difference Between a Fiber Route and an Available Connection
A fiber route demonstrates possible physical infrastructure, not necessarily a product that a nearby customer can order. Commercial connectivity requires sufficient topology, accessible facilities, capacity, rights, and suitable service arrangements.
Why nearby fiber does not guarantee service availability
A high-capacity long-haul cable can pass close to homes or businesses without distribution infrastructure to connect them. Customer service may require new laterals, splice points, electronics, construction permits, or an operator willing to offer a retail or wholesale product in the area.
Use proximity as a screening variable, not as a confirmation. A suitable pipeline may calculate distance to verified linework, then check availability data, public product offerings, and site-specific feasibility. The FCC map can indicate provider-reported access services at locations, but its availability records do not reveal every physical route needed to construct those services (https://help.bdc.fcc.gov/hc/en-us/articles/10476040597787-How-to-Submit-an-Availability-Challenge).
Access rights, spare capacity, and interconnection points
Even where route geometry is accurate, a third party may lack legal or commercial rights to use the conduit, cable, poles, or network capacity. Spare strands, lit capacity, dark-fiber lease terms, physical access, construction windows, and interconnection facilities may determine whether a proposed service is feasible.
These details are often contractual and not publicly documented. Do not infer spare capacity from the number of visible cables or from a long-haul network owner’s public map. Route screening should produce diligence questions for network engineering and procurement: where can service be handed off, who authorizes access, what work is required, and what terms are available?
Measuring Fiber Network Overlap and Geographic Gaps
Geospatial analysis can reveal candidate competitive overlap and regions that warrant further investigation, provided the calculation accounts for uncertainty, shared corridors, and missing data.
Route density and proximity analysis
Route density can be described as mapped kilometers of confirmed or reported fiber per geographic area, while proximity measures distance from a reference location to the closest candidate route. Both depend on source completeness, geometry precision, and the degree to which shared corridors are represented as separate cables.
Use consistent units and a defined study boundary. Report results separately for confirmed and inferred route layers. Counting all polylines as independent networks will overstate infrastructure competition when several layers describe one physical corridor. When evaluating overbuild, a location-level availability analysis may be more relevant than raw route density; see [INTERNAL LINK -> Blog 14 | broadband overbuild analysis | anchor: broadband overbuild analysis].
Identifying possible middle-mile bottlenecks
A possible middle-mile bottleneck exists where regional access networks appear to have few practical paths to major connectivity nodes or where the cost of transport may constrain expansion. Mapping can screen such places by combining reported route alternatives, exchange or hub locations, geography, and prospective demand.
However, absence from a public route map cannot establish monopoly control or lack of transmission capacity. Analysts should test candidate bottlenecks against operator disclosures, available wholesale products, and engineering feasibility. The NTIA Middle Mile Program exists in part to reduce connectivity costs for areas distant from robust regional networks (https://broadbandusa.ntia.gov/funding-programs/enabling-middle-mile-broadband-infrastructure-program).
Why Fiber Route Maps Become Outdated
Fiber maps change as cables are constructed, rerouted, acquired, upgraded, decommissioned, or repurposed. Updates to public records can lag field activity, while private commercial datasets may have uneven refresh cycles.
Incomplete disclosures and restricted data
Operators may withhold precise network alignments for security, contractual, or competitive reasons. Public documents may generalize routes to city or highway level, and agencies may redact sensitive utility information. An incomplete public map should therefore be labeled as an evidence collection, not a comprehensive inventory.
Source rights matter as well as coverage. Before redistributing a map or integrating licensed geometry into a customer-facing product, check whether the underlying sources permit storage, derivative analysis, and downstream disclosure. The correct analytical record retains license restrictions and citation metadata alongside route geometry.
Tracking new builds, upgrades, and abandoned plans
A monitoring system should capture construction milestones as separate events: proposed, funded, permitted, under construction, substantially complete, and operational where verified. A grant award or permit does not establish service activation. When plans are modified or abandoned, previous map versions should remain accessible with clear status changes.
Compare updates by project identity, segment, geography, and source evidence rather than blindly replacing old linework. This lets analysts ask whether a genuine physical extension occurred, whether geometry was corrected, or whether only a project timetable changed. NTIA’s award-recipient materials explicitly warn that grant details may be amended over time (https://broadbandusa.ntia.gov/funding-programs/enabling-middle-mile-broadband-infrastructure-program/award-recipients).
Using Fiber Maps in Investment and Expansion Decisions
Fiber network mapping can support market screening, network partnership searches, construction-cost estimation, and competitive analysis, but it should never be treated as a substitute for site-specific diligence. A robust sequence starts by defining the business objective, identifying current and potential routes, checking availability and demand indicators, and ranking candidate geographies by evidence quality and cost assumptions.
For example, a regional operator studying an underserved town might use an NTIA planned-route layer to identify possible future middle-mile access, compare it with existing reported broadband availability, and estimate distance to relevant nodes. That would create a shortlist for engineering inquiry, not proof that low-cost backhaul or last-mile connectivity can be obtained. If the route is merely planned, the scenario should be explicitly conditioned on completion and access rights. The investment record should identify verified geography, missing route evidence, commercial-access uncertainty, engineering dependencies, and potential competitor entry. An organization may use existing public or licensed data when it is sufficient; custom external-data collection and normalization, including services like Datamam’s, becomes more relevant when information must be maintained across heterogeneous disclosures and project announcements. The final decision should be based on a transparent chain of evidence from map layers to field verification, network design, commercial terms, and financial assumptions. For the market-ranking method, see [INTERNAL LINK -> Blog 13 | broadband expansion planning | anchor: broadband expansion planning].