
Key Takeaways
- Data quality is multidimensional: completeness, freshness, identity, geometry, definitions, and provenance matter separately.
- Validate the geographic universe before comparing providers or calculating served percentages.
- Unmatched, null, unavailable, and failed-collection states must remain distinct.
- Provider and technology normalization should be traceable to original source fields.
- Use issue severity and analytical impact rather than one universal accuracy score.
- Retain source vintages, rights information, and remediation history so results remain auditable.
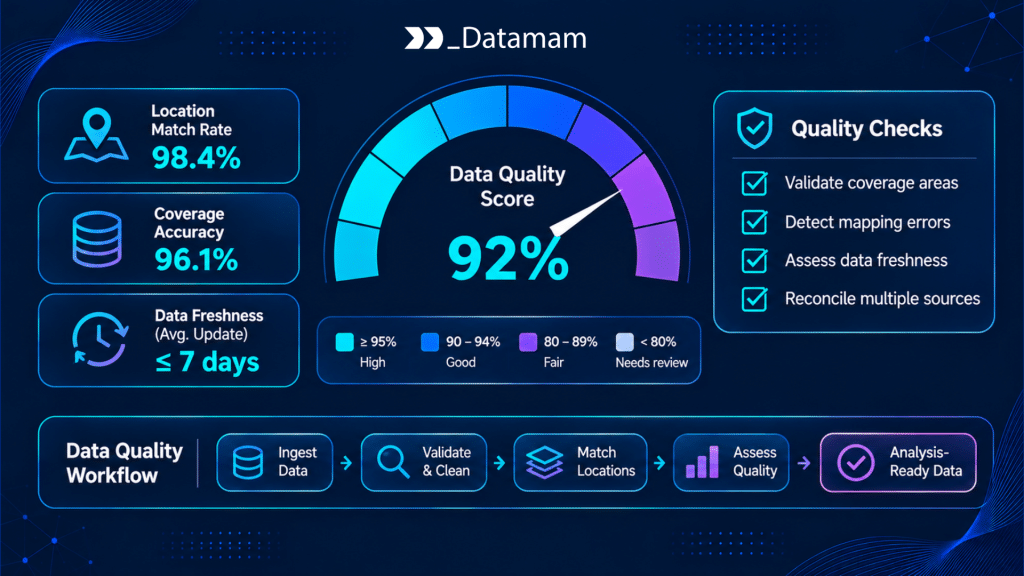
Broadband data quality determines whether availability, coverage, and competitor maps can support real business decisions. A clean-looking spreadsheet can contain duplicate provider records, stale reporting periods, misplaced locations, incompatible speed definitions, or missing values that are accidentally treated as evidence of no service. Those errors can distort estimates of competitive intensity, underserved markets, expansion opportunities, and investment risk.
A useful quality program measures specific defects against a defined source, geography, and analytical purpose. It distinguishes publisher errors from downstream matching problems, retains original data, and documents uncertainty instead of silently inventing corrections. This guide presents nine practical checks for FCC availability and related broadband datasets, followed by a remediation and decision-readiness framework.
Why Broadband Data Quality Determines Market Analysis Reliability
Broadband intelligence joins sources created under different definitions and collection methods. A location error affects geographic denominators; a provider identity error inflates competitor counts; and an outdated offer can misstate current pricing. An analysis may be mathematically correct while answering the wrong question because its source population is incomplete or inconsistent. For the US market, the FCC’s Broadband Data Collection documentation provides important context about reporting and downloadable data. Quality checks should be defined before dashboards and investment models consume those records, not applied only after unexpected numbers appear.
Nine Essential Broadband Data Quality Checks
These checks should be implemented as repeatable tests with documented thresholds, measured defect counts, and an owner responsible for investigating material failures. The appropriate tolerance depends on the decision: a national trend overview can accept different uncertainty from an address-specific capital expenditure approval.
1. Geographic coverage completeness
Compare the geographic extent and expected location universe against the intended study area. Identify missing counties, excluded territories, unrepresented serviceable locations, and systematic rural or multi-unit gaps. Use counts by state, county, and relevant submarket, not only one national completeness percentage. A file may be complete for the selected provider but unsuitable for all-provider competition analysis. When using the FCC Fabric, check that the version and geography match the availability vintage and the license. Absence from a public file should never automatically be interpreted as a definitive lack of broadband service.
2. Data freshness and reference dates
Store source reference date, publisher release date, download date, and processing timestamp separately. FCC BDC availability refers to June 30 and December 31 filing periods, while retail offers may change rapidly. A recent download of an old quarterly or semiannual dataset is not a real-time snapshot. Use freshness rules appropriate to each source and flag unexpected delays or non-updating fields. For change analysis, keep dataset vintages aligned before inferring new network buildout. A missed collection should trigger a pipeline status, not a false withdrawal of service from all affected addresses.
3. Identifier consistency
Validate location IDs, provider IDs, source record keys, and technology codes against the relevant versioned schema. Check for malformed values, unintended conversion from text to number, truncated leading zeros, and duplicate keys in tables that claim uniqueness. An identifier may be valid only within a particular source or vintage, so avoid assuming it is a global primary key. The FCC’s Fabric description illustrates how its location identifiers support availability reporting. When IDs change across releases, maintain an explicit historical crosswalk rather than forcing a one-to-one match that lacks evidence.
4. Duplicate records and entity matching
Duplicate-looking rows may be true duplicates, multiple speed tiers, distinct units in one building, or related but separate business entities. Define uniqueness by the intended analytical unit before deduplicating. For competition counts, a provider offering three plans at one location should not automatically become three competitors. In another dataset, several logical radio cells may belong to one physical site and should not be counted as towers. Store source-native records and derive a normalized entity view, with a reason and confidence for every merge. Excessive automatic deduplication can be just as damaging as leaving exact duplicates uncorrected.
5. Coordinate and address validity
Check coordinate ranges, null geometry, swapped latitude and longitude, appropriate projection, and points placed outside expected boundaries. Normalize address components, unit identifiers, and postal codes when matching. A point near a building is not necessarily the correct broadband-serviceable unit, particularly at apartment complexes or rural properties. Use spatial tolerances suited to the business decision and route ambiguous matches for review. Invalid polygons, self-intersections, and topology gaps also matter when mobile coverage or fiber routes are overlaid with demographics. Record which repairs are mechanical and which would require unsupported geographic inference.
6. Provider identity accuracy
One operator can appear under legal names, acquired subsidiaries, marketing brands, and aliases. Conversely, similar names may belong to unrelated businesses. Maintain a canonical provider dictionary with source identifiers and effective-dated corporate relationships, preserving original labels. Validate material corporate changes using reliable disclosures, such as SEC public filings where applicable. Define whether a market analysis counts brands, facilities-based networks, or consolidated parent organizations. A name-matching error can make a market appear more competitive or hide a merger-driven change even when all source rows otherwise look complete.
7. Technology and speed-field consistency
Check access-technology codes, download/upload units, allowed value ranges, low-latency flags where relevant, and whether speeds are advertised, modeled, or measured. A 100 Mbps fixed offering is not interchangeable with a 100 Mbps mobile modeled threshold or a 100 Mbps observed test average. Avoid merging fiber, cable, and wireless categories before the decision requires it. Validate plausible upload-to-download relationships but do not reject an unusual result solely because it differs from a typical plan. Preserve original field values and document normalization rules so analytical users can reproduce the classification.
8. Logical contradictions and missing values
Look for records that conflict with their own schema or stated context: a location linked to an invalid provider, a promotion ending before it begins, an empty service response misread as a confirmed negative, or a speed field missing from a supposedly complete availability row. Separate null, not applicable, unavailable, failed capture, and unverified status. Some contradictions signal legitimate source revisions rather than random error. Prioritize those capable of materially changing a coverage percentage, competitor map, or commercial ranking. Do not fill every blank with zero or the nearest plausible value just to satisfy a dashboard schema.
9. Provenance and permitted-use documentation
Every production record should be traceable to source name, version, retrieval channel, reference period, and transformations. Retain licensing or terms information relevant to internal processing, redistribution, and storage. A dataset can be geographically accurate yet unusable in a customer-facing commercial feed because its rights are restricted. FCC availability exports and the separately licensed Fabric require different handling; FCC Fabric access guidance describes the relevant agreement process. A rights or lineage omission is a quality problem for production, even when the numeric values appear correct.
How to Detect Conflicts Between Broadband Data Sources
Two sources can disagree because of a mistake, different scope, different time, or different definitions. Conflict handling should record both claims with provenance and status before attempting reconciliation. Choosing the latest visible number without understanding its meaning often creates a new error.
FCC availability versus operator offer information
The FCC map shows provider-reported availability under regulatory filing rules, while an operator’s website may return a live retail quote for a particular address and customer scenario. A failed checkout response does not automatically disprove the FCC row; it may reflect a website error, a restricted plan, or incomplete address validation. Conversely, an advertised launch may precede the next FCC data update. Compare the claimed service class, address, technology, and observation date first. For high-impact discrepancies, use an authorized sales or engineering confirmation and track whether an FCC challenge has been filed or resolved.
Different source vintages and geographic resolutions
A current county-level summary can conceal location-level changes, while a newly published source may refer to an older reference date than a less recently downloaded dataset. Store both source time and spatial resolution, and avoid joining an old mobile polygon directly to a newer fixed-location universe without labeling the mismatch. Compare like-for-like vintages for trends, then provide newer evidence as a separate update. Recompute denominators after administrative or Fabric changes. Source revisions can alter an apparent competitive gap even if no new network has been constructed.
Distinguishing Missing Data From Missing Broadband Service
Missing observations describe uncertainty about evidence. Missing service describes an actual market condition supported by relevant information. They must not be collapsed into one database null or a false ‘unserved’ flag.
Null values versus explicit unavailability
Define a status field such as available, explicitly unavailable, unknown, unmatched location, collection failed, and not assessed. A null retail price may mean the source did not publish a price, not that the subscription costs nothing. An omitted provider row may indicate the provider did not report service under the selected filing rules, but requires the correct location universe and technology filters for interpretation. Maintain these categories in calculations and exclude unknown states from denominators or show an uncertainty range when appropriate. Data consumers should see coverage of the analysis itself alongside service coverage.
How incorrect assumptions distort coverage statistics
Suppose a county contains 10,000 eligible locations, but the analyst successfully matches only 8,000. If 6,000 matched locations have a qualifying provider, the observed matched-location share is 75 percent, not necessarily 60 percent of all locations or the true countywide service share. Treating the 2,000 unmatched addresses as unserved creates a lower bound under assumptions that may be inappropriate. Report matched-location completeness and a plausible sensitivity range. This makes the uncertainty explicit and prevents a source-join failure from being presented as evidence for a large new infrastructure opportunity.
Building a Broadband Data Quality Scorecard
A useful scorecard has separate metrics for each quality dimension, issue severity, market impact, and trend. It should tell the operator which records can be used for which decisions, not issue one abstract grade without supporting detail.
Defining meaningful validation thresholds
Define checks such as percentage of valid IDs, match rate to expected locations, share of rows with source dates, number of unresolved provider conflicts, and acceptable data age for each source. Thresholds should match operational risk: an investment decision may require stronger location and ownership certainty than a broad research overview. Include known exclusions and the cost of false positives and false negatives. A high completeness score must not compensate automatically for a critical license issue or corrupted coordinates. Use gate criteria for non-negotiable failures and weighted scores only for comparable dimensions.
Tracking quality changes over time
Save quality metrics by source vintage, provider, geography, and processing version. A sudden increase in unmatched locations may indicate new Fabric IDs, schema drift, or broken address normalization rather than a deterioration in real market coverage. Compare defect rates using stable denominators and annotate changes in upstream publisher methods. Alerts should identify new structural failures before the analytics team reports a false market event. Historic quality trends also help evaluate vendors, collection pipelines, and the effect of remediation work without claiming that all discrepancies have been permanently eliminated.
Remediating Common Broadband Data Problems
Remediation should be conservative, repeatable, and reversible. Correct mechanical defects with documented rules, then escalate ambiguous business facts for review. Preserve both raw input and normalized output to protect auditability.
Correcting invalid identifiers and inconsistent fields
Use authoritative code lists, schema dictionaries, coordinate reference rules, and verified ID crosswalks to fix typographic or formatting defects. Do not assign a provider based solely on a fuzzy string resemblance if that decision affects competitor counts. For speed fields, convert units only when the original unit is known and keep the source value visible. Flag records that cannot be corrected deterministically. A remediation log should include old value, new value, rule applied, timestamp, and affected output version. Rerun related quality tests after each correction rather than assuming one successful transformation fixes every downstream join.
Flagging uncertain records rather than inventing replacements
When a tower owner, service address, or provider affiliation remains unresolved, retain candidate matches and uncertainty labels. Do not generate synthetic site coordinates or assign a commercially convenient operator to make a map complete. The correct output may be an evidence gap that triggers a targeted field check or source request. For high-value market decisions, quantify how excluded uncertain records affect the ranking. A defensible ‘unknown’ state often protects more value than an apparently complete but unverifiable dataset that analysts later treat as ground truth.
When Is Broadband Data Reliable Enough for Investment Analysis?
A dataset is fit for purpose when its known error modes are controlled to an acceptable level for the particular decision, not when every field passes one universal accuracy target. For market screening, a transparent source-vintage map with documented gaps may be sufficient to identify candidates. For committing construction funds, critical assumptions about location, competitors, infrastructure, rights, and costs require stronger verification. Quality gates should therefore be tied to potential financial impact.
Before approval, ask whether plausible data errors could reverse the decision. If a small number of ambiguous locations change a market from attractive to unattractive, investigate them. If the result remains robust across documented uncertainty ranges, the team can proceed with explicit residual risks. Broadband data quality succeeds when it makes decisions reproducible and appropriately cautious, not merely when dashboards contain no blank cells.