Key Takeaways
- Analytics Data Quality determines whether enterprise reporting can scale with trust.
- Data quality for analytics defines the minimum standard for reliable dashboards, models, and business intelligence.
- Analytics data accuracy depends on consistent definitions, valid transformations, and controlled source inputs.
- Data quality in business intelligence declines when metrics depend on incomplete, stale, or conflicting data.
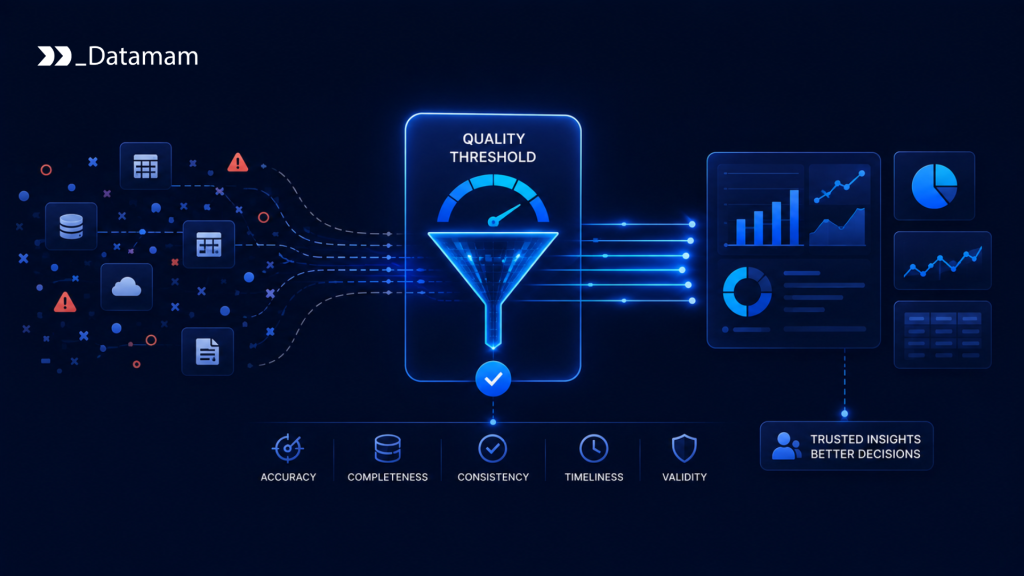
Analytics data quality determines whether enterprise reporting can scale with trust. Many organizations have dashboards, business intelligence platforms, semantic layers, data warehouses, and analytics teams, but still struggle to turn analytics into consistent decision infrastructure. The issue is rarely that analytics tools are unavailable. It is that the underlying data does not consistently meet the quality threshold required for recurring business decisions.
Analytics Data Quality refers to the standard of completeness, accuracy, freshness, consistency, validity, uniqueness, and traceability required for analytics outputs to be trusted at enterprise scale. It includes data quality for analytics, analytics data accuracy, data quality in business intelligence, metric consistency, transformation testing, validation rules, metadata, lineage, observability, data profiling, audit logs, and governance controls.
Analytics Data Quality Determines Whether Enterprise Reporting Can Scale With Trust
Enterprise analytics fails when users cannot move from output to action without first questioning the data. A dashboard may be available, but teams may still ask whether it refreshed on time. A metric may be visible, but users may not know whether the definition matches finance, sales, or operations. A BI report may load quickly, but the underlying transformation may contain logic that has not been tested or documented.
At small scale, teams can compensate with manual checks. Analysts compare outputs against source systems. Business users ask data teams to validate numbers. Finance teams reconcile reports before leadership meetings. However, as analytics spreads across departments, this model breaks down. The organization cannot scale analytics if every insight requires manual confidence-building before it can be used.
McKinsey’s State of AI 2025 notes that many organizations are using AI, but fewer have embedded it deeply into enterprise workflows. The same pattern applies to analytics. Adoption is not the same as scalable impact. Reliable analytics requires governed, reusable, quality-controlled data products beneath the reporting layer.
Data Quality for Analytics Defines the Minimum Standard for Reliable Dashboards, Models, and Business Intelligence
Data quality for analytics defines the minimum standard a dataset must meet before it supports dashboards, models, reports, forecasts, or executive reviews. That standard depends on the use case. A weekly marketing analysis may tolerate different freshness requirements from a revenue operations dashboard. A finance report may require stronger reconciliation and auditability than an exploratory product analysis. A risk dashboard may require stricter completeness and latency thresholds than a historical trend report.
The threshold should include completeness, accuracy, consistency, timeliness, uniqueness, validity, and integrity. It should also include context: who owns the dataset, which definition is approved, which transformations are applied, which checks passed, and which downstream systems consume it.
In practice, analytics quality is not only about whether values are correct. It is about whether the data is reliable enough for the decision it supports.
Analytics Data Accuracy Depends on Consistent Definitions, Valid Transformations, and Controlled Source Inputs
Analytics data accuracy depends on more than raw source correctness. A source system may capture data accurately, but analytics outputs can still become inaccurate if transformations are inconsistent, joins are flawed, business definitions differ, or source fields are interpreted incorrectly.
For example, “active customer” may mean logged in during the last 30 days to a product team, current contract to sales, paid invoice to finance, and open account to customer success. Each definition may be valid for its own context. However, if the BI layer does not clarify the approved definition for each metric, analytics accuracy becomes situational rather than reliable.
Therefore, accuracy depends on source quality, transformation discipline, semantic clarity, and ownership. Without those controls, analytics teams can produce technically correct outputs that still fail as enterprise decision assets.
Why Analytics Breaks Down When Data Quality Falls Below Threshold
Analytics breaks down when the quality threshold falls below the level required for repeated decision-making. The failure does not always appear as a visible system outage. More often, it appears as uncertainty. Teams question dashboards. Metrics conflict. Forecasts require caveats. Reports need manual cleanup. Executives ask which number is correct.
Gartner’s 2025 Data and Analytics Predictions highlights risks around AI governance, model accuracy, and compliance as organizations expand data and analytics use. The same risk logic applies to business intelligence: as analytics influences more decisions, weak quality creates wider operational exposure.
Data Quality in Business Intelligence Declines When Metrics Depend on Incomplete, Stale, or Conflicting Data
Data quality in business intelligence declines when BI metrics depend on incomplete, stale, or conflicting data. A revenue dashboard may exclude late-arriving transactions. A customer report may double-count duplicate accounts. A product dashboard may miss attributes from incomplete catalog records. A supply chain report may rely on stale inventory feeds. A marketing analysis may depend on inconsistent campaign naming.
These issues undermine confidence because users cannot tell whether a change in the dashboard reflects business reality or data failure. A decline in conversion rate may be a real market signal. It may also be caused by missing campaign mappings. A rise in customer churn may reflect actual behavior. It may also be caused by a changed customer status rule.
At scale, BI quality requires controls that separate business change from data defect.
Small Quality Issues Become Strategic Problems When They Affect Recurring Executive Decisions
Small quality issues become strategic problems when they affect recurring executive decisions. A missing field in an isolated dataset may be manageable. The same missing field in a board-level revenue dashboard is different. A delayed refresh may be acceptable for exploratory analysis. It is not acceptable when the output informs daily pricing, inventory, risk, or financial decisions.
The strategic issue is dependency. If many teams depend on the same analytics asset, its quality threshold must be higher. Critical dashboards, recurring KPI reports, AI monitoring views, finance analytics, customer health reporting, and risk dashboards should not rely on informal validation or analyst memory.
Accordingly, organizations need a quality classification model for analytics assets. The more critical the decision, the stronger the threshold should be.
The Strategic Cost of Weak Analytics Data Quality
Weak analytics data quality creates strategic cost through slower decisions, lost trust, repeated reconciliation, reduced BI adoption, weaker forecasting, and increased dependency on manual review. The organization may invest in modern analytics tools, but if the data layer is unreliable, users will not treat analytics as a system of record.
IBM’s 2025 CDO Study emphasizes that advanced analytics and AI require high data quality and strong governance frameworks. This matters because scalable analytics does not come from dashboard proliferation. It comes from trusted data products that business users can rely on repeatedly. Data accuracy solutions for enterprises can enhance decision-making and foster trust among users. By implementing these solutions, organizations can streamline their analytics processes and ensure that stakeholders have access to reliable data. This transformation ultimately leads to improved business outcomes and a greater focus on strategic initiatives.
Business Teams Lose Confidence When Dashboards Require Manual Reconciliation Before Use
Business teams lose confidence when dashboards require manual reconciliation before use. If analysts must verify every major metric before meetings, the dashboard becomes a starting point for investigation rather than a decision tool. If finance must reconcile numbers outside the BI platform, the official analytics environment loses authority. Also, if sales, marketing, and operations each maintain different versions of the same KPI, the enterprise loses alignment.
Manual reconciliation also creates hidden costs. Skilled analysts spend time comparing data instead of interpreting performance. Business users delay action while waiting for validation. Engineering teams receive recurring questions about whether the data is correct.
Ultimately, weak analytics quality converts business intelligence into business uncertainty.
Executive Decisions Slow Down When Analytics Outputs Cannot Be Explained, Traced, or Reproduced
Executive decisions slow down when analytics outputs cannot be explained, traced, or reproduced. Leaders need to know where a number came from, how it was calculated, when it refreshed, which sources contributed to it, and whether quality checks passed.
When this evidence is missing, teams must reconstruct the logic after the question is raised. They inspect pipelines, review transformation code, compare reports, and ask source-system owners for context. This slows decisions and weakens executive confidence.
Analytics at enterprise scale requires reproducibility. A number should not only appear in a dashboard. It should be traceable through source inputs, transformations, quality checks, lineage records, and approved definitions.
How Quality Thresholds Improve Analytics Reliability
Quality thresholds improve analytics reliability by defining when data is suitable for publication, when it should be quarantined, and when it requires remediation. Without thresholds, quality becomes subjective. One team may publish a dashboard with incomplete fields. Another may block delivery. A third may manually adjust outputs before release.
The NIST AI Risk Management Framework is organized around governance, mapping, measurement, and management. These principles apply directly to analytics quality because business intelligence systems also require measured risk, controlled inputs, and governed outputs.
Completeness, Freshness, Validity, Consistency, and Uniqueness Controls Define Analytics Readiness
Analytics readiness should be measured through quality dimensions that match the use case. Completeness confirms required fields are present. Freshness confirms data arrived within the required window. Validity confirms values follow expected formats and allowed ranges. Consistency confirms metrics and definitions align across systems. Uniqueness confirms records are not duplicated where uniqueness is required.
A simple readiness gate can determine whether analytics data should be published: Data quality assessment for enterprises is crucial for ensuring that business insights are accurate and actionable. Organizations must regularly evaluate their data quality metrics to maintain a competitive edge in the market. By prioritizing data quality assessment for enterprises, companies can build trust in their analytical capabilities and drive better decision-making processes.
def evaluate_analytics_readiness(dataset):

    if dataset["completeness_rate"] < dataset["required_completeness_rate"]:

        return {"publish": False, "reason": "completeness_threshold_failed"}


    if dataset["freshness_minutes"] > dataset["max_freshness_minutes"]:

        return {"publish": False, "reason": "freshness_threshold_exceeded"}


    if dataset["validity_rate"] < dataset["required_validity_rate"]:

        return {"publish": False, "reason": "validity_threshold_failed"}


    if dataset["duplicate_rate"] > dataset["max_duplicate_rate"]:

        return {"publish": False, "reason": "duplicate_threshold_exceeded"}


    if dataset["lineage_status"] != "documented":

        return {"publish": False, "reason": "lineage_missing"}


    return {"publish": True, "dataset_id": dataset["dataset_id"]}


dataset = {

    "dataset_id": "executive-revenue-dashboard",

    "completeness_rate": 99.2,

    "required_completeness_rate": 98.5,

    "freshness_minutes": 28,

    "max_freshness_minutes": 60,

    "validity_rate": 99.7,

    "required_validity_rate": 99.0,

    "duplicate_rate": 0.01,

    "max_duplicate_rate": 0.05,

    "lineage_status": "documented",

}


evaluate_analytics_readiness(dataset)
This pattern shows that analytics readiness should be determined before data reaches executive dashboards or BI tools.
Quality Thresholds Help Teams Decide Whether Data Should Be Published, Quarantined, or Remediated
Quality thresholds create clear decision paths. If data meets the threshold, it can be published. If it fails a critical threshold, it should be quarantined or blocked. Also, if it fails a non-critical threshold, it may be published with a warning, exception approval, or remediation tracking, depending on the use case.
This matters because not all quality failures carry the same risk. A low-impact exploratory report may tolerate minor incompleteness. A finance dashboard, AI monitoring report, or risk analytics workflow may require strict blocking rules.
In practice, quality thresholds reduce ambiguity. Teams do not need to debate every defect from scratch. The threshold defines the expected response.
The Infrastructure Layer Behind Scalable Analytics Quality
Scalable analytics quality requires infrastructure that can measure, enforce, and explain quality across pipelines, platforms, and BI environments. Validation, profiling, observability, metadata, lineage, semantic governance, and audit logs must work together.
Great Expectations can validate schema, completeness, uniqueness, ranges, and accepted values. dbt can test transformations, document models, and support governed metric logic. Airflow can orchestrate analytics pipelines and quality gates. Spark can profile large datasets. Snowflake, BigQuery, and Databricks can support analytical storage and compute. Prometheus and data observability systems can monitor freshness, latency, errors, and atypical behavior. BI governance systems can help control metric definitions, dashboard ownership, and report certification.
Validation, Profiling, Observability, Metadata, Lineage, and Audit Logs Make Analytics Quality Measurable
Validation confirms whether data meets defined rules. Profiling identifies distributions, missing values, outliers, duplicates, and drift. Observability shows whether data pipelines and datasets behave within expected thresholds. Metadata explains ownership, definitions, classification, and refresh cadence. Lineage shows how data moved and transformed. Audit logs show who changed logic, approved exceptions, and resolved quality incidents.
Together, these capabilities make analytics quality measurable. They allow analytics teams to answer core questions quickly. Is the data fresh? Is the metric definition approved? Did transformations pass tests? Which source contributed to the output? Who owns the dataset? Which dashboards are affected by a failure?
Without these controls, BI trust depends on manual explanation. With them, analytics quality becomes evidence-based.
Great Expectations, dbt, Airflow, Spark, Snowflake, BigQuery, Databricks, Prometheus, and BI Governance Systems Support Scalable Analytics Controls
Each system supports scalable analytics controls when used inside a clear quality operating model. Great Expectations and dbt support quality and transformation testing. Airflow coordinates dependencies and quality gates. Spark supports profiling and transformation at scale. Snowflake, BigQuery, and Databricks provide governed analytical environments. Prometheus and observability systems detect operational issues. Metadata and BI governance systems connect datasets, dashboards, definitions, and owners.
However, tools do not create analytics trust automatically. A dbt test failure still needs ownership. A Great Expectations validation issue still needs remediation. A dashboard certification process still requires approved definitions and lifecycle review. A lineage graph still needs governance action when a critical upstream source changes.
Therefore, analytics quality depends on infrastructure plus ownership, thresholds, and decision rules.
Governance, Compliance, and Auditability Shape Analytics Trust
Analytics trust depends on governance, compliance, and auditability. Many BI outputs support financial reporting, customer decisions, operational planning, risk review, workforce management, pricing strategy, and market intelligence. If the data is sensitive, regulated, externally sourced, or used across jurisdictions, the quality threshold must include permitted use, classification, access control, sourcing evidence, and audit logs.
Data quality in business intelligence is especially important when dashboards become de facto decision records. If leaders use BI outputs for recurring planning or performance review, the organization needs evidence behind those outputs.
Auditability Turns Analytics Outputs Into Defensible Decision Assets
Auditability turns analytics outputs into defensible decision assets. When a metric is questioned, teams need to show the source data, transformation logic, quality checks, refresh history, access records, and approval status. Without auditability, teams reconstruct the story manually after the fact.
This is costly and risky. A number used in executive review should not depend on undocumented logic. A risk dashboard should not lack lineage. A finance analytics output should not require manual proof each reporting cycle.
Accordingly, auditability should be part of the analytics quality threshold. Trusted analytics requires evidence, not only visual presentation.
External and Third-Party Data Require Additional Analytics Quality Controls
External and third-party data require additional controls because coverage, freshness, sourcing, normalization, and permitted use may vary. A competitor pricing dataset may have inconsistent coverage across regions. A supplier-risk feed may change source structure. A market intelligence dataset may require legal review before redistribution or AI use. A public data source may be valid for analysis but insufficient for automated operational decisions.
Analytics teams should not treat external data as another table without context. They need sourcing metadata, refresh monitoring, normalization rules, quality thresholds, and usage controls.
In this context, analytics quality includes both technical fitness and sourcing legitimacy.
Why Analytics Data Quality Is Becoming an Executive Governance Issue
Analytics Data Quality is becoming an executive governance issue because enterprise leaders increasingly rely on BI and analytics for strategic, financial, operational, and risk decisions. If analytics outputs are unreliable, the enterprise does not simply have a reporting problem. It has a decision infrastructure problem.
Executives do not need to manage every dashboard or validation rule. However, they need visibility into which analytics assets are trusted, which metrics are certified, which dashboards lack owners, which quality thresholds are failing, and which BI outputs support critical decisions. Data quality and operational efficiency are crucial for maintaining a competitive edge in today’s business landscape. Ensuring that data is accurate and accessible allows organizations to make informed decisions swiftly. By prioritizing these aspects, companies can leverage analytics to drive growth and innovation effectively.
Leaders Need Visibility Into Which Quality Gaps Affect BI, Forecasting, AI, Finance, Risk, and Operations
Leadership visibility should focus on analytics impact. Which dashboards support executive reviews? Which metrics are used in forecasting? Also, which BI datasets feed AI monitoring? Which finance analytics outputs require reconciliation? Which operational dashboards fail freshness thresholds? Also, which risk reports depend on external data sources? Which analytics assets lack lineage or ownership?
This visibility helps leaders prioritize quality investment. Not every dashboard needs the same standard. However, recurring decision assets should have defined owners, approved definitions, freshness rules, validation checks, lineage, and auditability.
In this context, quality becomes a governance layer for enterprise analytics.
Scalable Analytics Programs Require Quality Thresholds, Ownership Models, Governance Standards, and Continuous Review
Scalable analytics programs require quality thresholds that define readiness for publication and use. They require ownership models that assign responsibility for definitions, source inputs, transformations, dashboards, and remediation. Also, they require governance standards for certified metrics, sensitive data, external sources, lineage, access controls, and audit logs.
They also require continuous review. Business definitions change. Source systems evolve. Data volumes grow. BI assets multiply. AI workflows consume analytics datasets in new ways. Without review, analytics quality degrades even if the original implementation was sound.
Ultimately, Analytics Data Quality determines whether enterprise reporting can scale with trust. Data quality for analytics defines the minimum standard for reliable dashboards, models, and business intelligence. Analytics data accuracy depends on consistent definitions, valid transformations, and controlled source inputs. Data quality in business intelligence becomes strategic when BI outputs influence recurring decisions.
Organizations that define and enforce analytics quality thresholds will scale reporting, forecasting, AI monitoring, and decision intelligence with stronger confidence. Organizations that treat analytics quality as a dashboard-level issue will continue to spend time reconciling outputs, debating definitions, and delaying decisions that should already be supported by trusted data.