Key Takeaways
- Subscriber share, service-revenue share, and availability share answer different questions.
- Use a common market definition, period, geography, and corporate ownership treatment.
- Active SIMs, mobile connections, accounts, and unique people are not equivalent units.
- Exclude unrelated equipment and non-comparable wholesale revenue from retail service benchmarks.
- Homes passed and reported provider availability are not paid subscriptions.
- Publish denominator assumptions and sensitivity ranges when public reporting is incomplete.
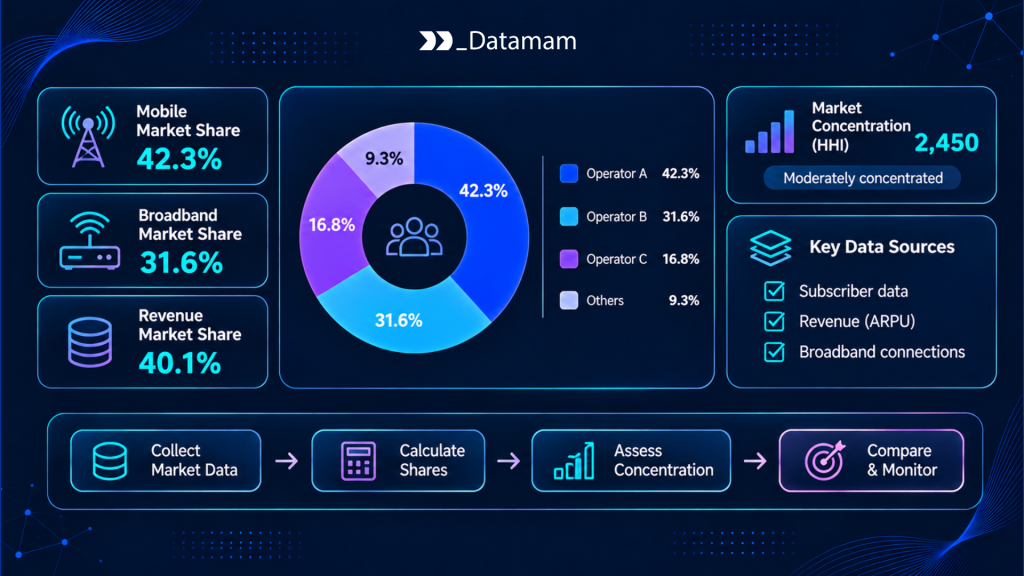
Telecom market share analysis sounds simple: divide an operator’s activity by the size of the market. In practice, the numerator and denominator can describe subscribers, active SIMs, service revenue, connected households, wholesale relationships, or reported geographic availability. Those metrics are not interchangeable, and using one in place of another can produce persuasive but fundamentally incorrect rankings.
A credible analysis defines the service category, market boundary, time period, reporting entities, and unit of measure before collecting operator numbers. It then reconciles differences in prepaid activity, multi-line accounts, brands, wholesale revenue, and network footprints. This guide shows how to calculate meaningful subscriber and revenue shares while keeping coverage and infrastructure presence in their proper role as distinct indicators.
Why Telecom Market Share Has More Than One Meaning
Market share is a fraction, but its interpretation depends entirely on the quantities being counted. A telecom analyst should state the product, geography, period, numerator, and denominator with the reported percentage. Without that definition, two figures labeled ‘market share’ can differ for legitimate reasons and still be misleading when compared.
Subscriber share
Subscriber share compares one operator’s qualifying active connections or subscriptions with the corresponding total for a defined market. It may be useful for mobile services, fixed broadband, or a specific business segment, but the underlying counts must be aligned. A household with home internet and several mobile lines contributes differently depending on the category. Define whether the unit is paying subscriptions, accounts, SIMs, or unique users; also explain how inactive or temporarily suspended accounts are treated. An operator reporting net additions for a quarter cannot be directly compared with another reporting end-period active subscribers without reconciling the stock and flow definitions.
Revenue share
Revenue share measures a company’s relevant revenue against the total comparable revenue earned within a specified sector and geography. It can reveal a different competitive structure from subscriber share because operators have different average revenues per connection and product mixes. For example, a carrier with fewer subscribers may have a higher share of business connectivity revenue if it serves high-value enterprise accounts. Define whether the measure includes only retail service, wholesale access, equipment, advertising, or other non-service income. Public company reports and SEC EDGAR filings can provide inputs but may require careful segment reconciliation before calculation.
Geographic availability and infrastructure presence
Availability share describes where an operator reports that service can be offered. Infrastructure presence describes assets, licenses, or facilities that support service. Neither is equivalent to the share of customers who subscribe. A provider appearing at 30 percent of broadband-serviceable locations does not necessarily serve 30 percent of customers in the study market. The FCC’s National Broadband Map is a valuable availability reference, but reported reach should be labeled footprint exposure rather than subscriber market share. These geographic indicators help explain competitive opportunity and overlap, not substitute for adoption data.
How to Define a Comparable Telecom Market
A valid denominator requires a coherent product category and study boundary. Analysts should record the service type, customer segment, retail versus wholesale scope, currency and reporting period, and whether multiple brands owned by one corporate group are consolidated.
Fixed broadband versus mobile services
Fixed broadband subscriptions generally represent service at premises, while mobile statistics may count subscriptions or SIM connections associated with individuals, devices, or machine-to-machine services. One residential home connection and three mobile SIMs are not four units of the same market. Build separate denominators by service type and clarify whether business and residential connections are included. For bundled customers, allocate revenue consistently rather than counting the total bundle under both product segments. A cross-sector ‘telecom share’ number is defensible only when a clearly defined combined revenue base is available and the underlying units are not mixed.
Retail brands, wholesale services, and corporate ownership
An operator can market several retail brands and also wholesale access to independent brands. An MVNO can compete for retail customers while relying on a host network, and a broadband brand may resell an infrastructure owner’s access service. For retail subscriber share, count subscriptions under the customer-facing seller and consistently consolidate ownership when desired. For infrastructure share, a separate facilities-based view is appropriate. Avoid counting the same end subscriber under both a wholesale host and a retail MVNO in one denominator. Effective dates matter because mergers and brand reorganizations can move reported connections between corporate groups without a corresponding change in underlying demand.
Choosing the correct geographic denominator
National totals may be unsuitable for regional competition, but local subscriber counts are often not published. A provider’s US-wide figure cannot be divided by one county’s estimated active subscriptions to create a local share. If exact local data are unavailable, describe an estimated share with methodology and uncertainty, or use a different metric such as local provider availability. Keep the study boundary consistent with operator service geographies and exclude markets where a provider does not compete under the chosen service definition. For cross-year comparisons, maintain stable boundaries and address changes in administrative geography.
Calculating Subscriber Market Share
The basic calculation is operator qualifying active subscriptions divided by total qualifying subscriptions in the same market and period, multiplied by 100. The difficult work lies in ensuring that the counts use the same definition and exclude duplication.
Active subscriptions versus unique customers
A subscription may be one active service contract, one phone line, or another recognized access account. Unique customers count distinct people or businesses and can differ substantially when one household or company holds multiple lines. If a carrier reports connections rather than individuals, compare it with a connection-based denominator. Do not silently use population as a proxy for subscriptions, because some people hold multiple SIMs while others hold none. ITU DataHub statistics supply internationally structured indicator definitions, which can help explain why subscription penetration can exceed 100 percent of population without implying that every person subscribes.
Prepaid, postpaid, and multi-SIM considerations
Prepaid counts may depend on recent recharge or usage activity, while postpaid plans may count active billed lines. Multi-SIM devices, family plans, IoT connections, and corporate fleets can alter aggregate totals. A benchmark must distinguish consumer mobile subscriptions from machine-to-machine connections when reporting allows. Record how each company defines an active account and whether non-paying or promotional lines are excluded. If one operator’s prepaid base uses a 90-day activity rule and another uses a different threshold, a raw ranking may be inconsistent. Estimate a range or state the limitation instead of inventing exact reconciled numbers.
Comparing operator reporting periods
A December 31 subscriber count should not be compared with a June 30 figure without acknowledging the six-month gap. Fiscal years and calendar years can differ, and acquisitions may change consolidated subscribers midyear. Store ‘as of’ dates, currency, entity boundaries, and restatements for every company. When assembling a current market snapshot from staggered disclosures, use the latest compatible period, disclose gaps, and avoid treating the result as a synchronized census. Historical comparisons should account for reporting changes before claiming organic share gains or losses.
Measuring Revenue-Based Market Share
Revenue-based market share may be more commercially meaningful than connections for certain enterprise or wholesale segments. But it requires alignment of service categories, geography, accounting periods, currency, and corporate consolidation. A revenue measure is only comparable when the underlying activities match.
Service revenue versus total company revenue
Company totals can include handsets, devices, equipment installation, financial services, and businesses unrelated to telecom access. For a mobile service-revenue share, use comparable mobile service segments rather than total consolidated sales. For broadband, avoid comparing one company’s fixed-service revenue against another company’s entire consumer division. Public annual reports and SEC company disclosures may contain segment notes needed for a defensible extraction. If reporting does not separate the category, label the share estimated and explain the allocation, or omit the result rather than present false precision.
Differences between retail and wholesale revenue
Wholesale revenue can represent network access sold to resellers, other carriers, or enterprise intermediaries. If the analysis is about retail customer spending, including the wholesale host’s receipts as well as the reseller’s full retail bill can double-count part of the same economic activity. Define the market as retail spending or supplier revenue and apply that choice throughout. Treat intercompany transfers within consolidated groups consistently, and avoid combining public-company segments without inspecting accounting notes. Wholesale market share is a legitimate separate research question, but its denominator and competitive set differ from consumer-facing mobile or broadband subscriptions.
Can Network Coverage Be Used to Estimate Market Share?
Coverage can contribute to an estimate of addressable opportunity or competitive exposure, but it cannot directly establish realized share. A network can report service where almost nobody subscribes, while another can be highly penetrated in a smaller area. Use coverage as a supporting predictor only when calibrated against actual subscription information.
Why homes passed are not subscribers
Homes passed describes premises near or within reach of deployed network infrastructure under a provider’s engineering definition. It does not measure active accounts, install success, customer willingness to pay, or churn. A provider passing 50,000 homes at 20 percent take rate has about 10,000 subscriptions under that illustrative scenario, not 50,000. The exact outcome requires validated subscriber reporting. If no current take-rate evidence exists, model low, middle, and high ranges instead of publishing a single inferred figure. Also check whether multi-dwelling units count as one location or several serviceable units.
Why address-level provider counts do not prove penetration
The FCC map can show two or three providers reporting service at an address, but that count says nothing about which one residents choose. Equal availability does not imply equal subscribers, and a newly available competitor may have very low adoption initially. To estimate penetration, join verified subscription counts or defensible surveys to a matching geographic market. A proxy such as provider presence should be clearly labeled an explanatory variable, not market share. This distinction is especially important when evaluating overbuild or claiming that a company has gained share based solely on growth in reported availability rows.
Data Sources for Telecom Market Share Estimates
Use a source hierarchy suited to the metric: official telecommunications indicators for broad comparability, company reporting for operator-specific counts, and selected research when public breakdowns are unavailable. Document the limitations and usage rights of every source.
Regulatory statistics and operator reports
National regulators may collect subscriber, revenue, or traffic statistics under specific definitions; annual reports and investor presentations provide operator-reported segments. ITU’s telecommunications indicators support high-level market comparison but are generally not direct substitutes for local operator-level totals. Reconcile whether figures represent fixed access, mobile connections, active SIMs, consumer accounts, or enterprise circuits. Use source publication and reference dates separately. When an agency revises historical values or an operator changes segment reporting, rebuild the comparable series rather than simply appending the new number.
Commercial research and estimated market data
Analyst services can estimate market shares using proprietary surveys, operator disclosures, and modeled data. Evaluate their geography, definitions, estimation period, confidence, and permission to reuse the figures. A purchased table with two decimal places is not necessarily more accurate than a clearly described internal range. Ask what subscriber categories are included, how private operators are handled, and whether wholesale connections are double-counted. Where competing commercial estimates disagree, explain the methodological difference rather than averaging them without justification. Store the licensed source reference so users can reproduce or challenge a decision.
Common Errors in Telecommunications Market Share Calculations
The most frequent errors are mixing active SIMs with unique people, combining retail with wholesale, using inconsistent reporting periods, assigning national totals to small geographies, and treating coverage as paid adoption. Another mistake is consolidating brands under one parent in the numerator but leaving them separate in the denominator. Each can produce a plausible percentage that is wrong for the intended question. A basic validation rule is to check that each counted unit belongs to exactly one category and that the same account is not credited twice.
For a hypothetical market with 1.2 million active mobile connections, an operator with 300,000 qualifying connections has 25 percent connection share. If another source reports one million unique subscribers rather than 1.2 million connections, the same numerator cannot be divided by that different denominator and presented as comparable. The labels and definitions must travel with the figure.
Choosing the Right Market Share Metric for Competitive Analysis
Choose subscriber share when the question concerns customer base, service revenue share when evaluating economic position, and provider availability or population exposure when researching geographic opportunity. For an MVNO market, brand-level retail subscriptions may matter more than physical network count; for infrastructure investment, network-owner footprint overlap may be the correct measure. Include the reporting period, geography, service category, entity consolidation, and source quality beside each result.
Market share becomes decision-ready when every numerator and denominator can be traced to compatible evidence. Where local figures are missing, the most useful output may be an honest range or a set of separate performance and coverage indicators, rather than one confident percentage that the data cannot support.